Copyright
©The Author(s) 2017.
World J Cardiol. Apr 26, 2017; 9(4): 320-331
Published online Apr 26, 2017. doi: 10.4330/wjc.v9.i4.320
Published online Apr 26, 2017. doi: 10.4330/wjc.v9.i4.320
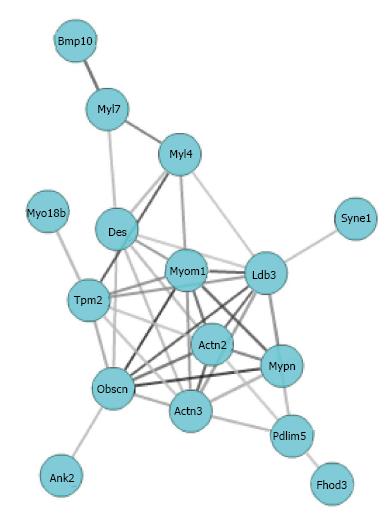
Figure 3 Mypn gene network graph created using Gene-set Cohesion Analysis Tool described in the methods.
Gene symbols are located at nodes in circles and lines interconnecting the nodes are based on literature correlation.
- Citation: Gu Q, Mendsaikhan U, Khuchua Z, Jones BC, Lu L, Towbin JA, Xu B, Purevjav E. Dissection of Z-disc myopalladin gene network involved in the development of restrictive cardiomyopathy using system genetics approach. World J Cardiol 2017; 9(4): 320-331
- URL: https://www.wjgnet.com/1949-8462/full/v9/i4/320.htm
- DOI: https://dx.doi.org/10.4330/wjc.v9.i4.320


