Copyright
©The Author(s) 2016.
World J Cardiol. Nov 26, 2016; 8(11): 623-637
Published online Nov 26, 2016. doi: 10.4330/wjc.v8.i11.623
Published online Nov 26, 2016. doi: 10.4330/wjc.v8.i11.623
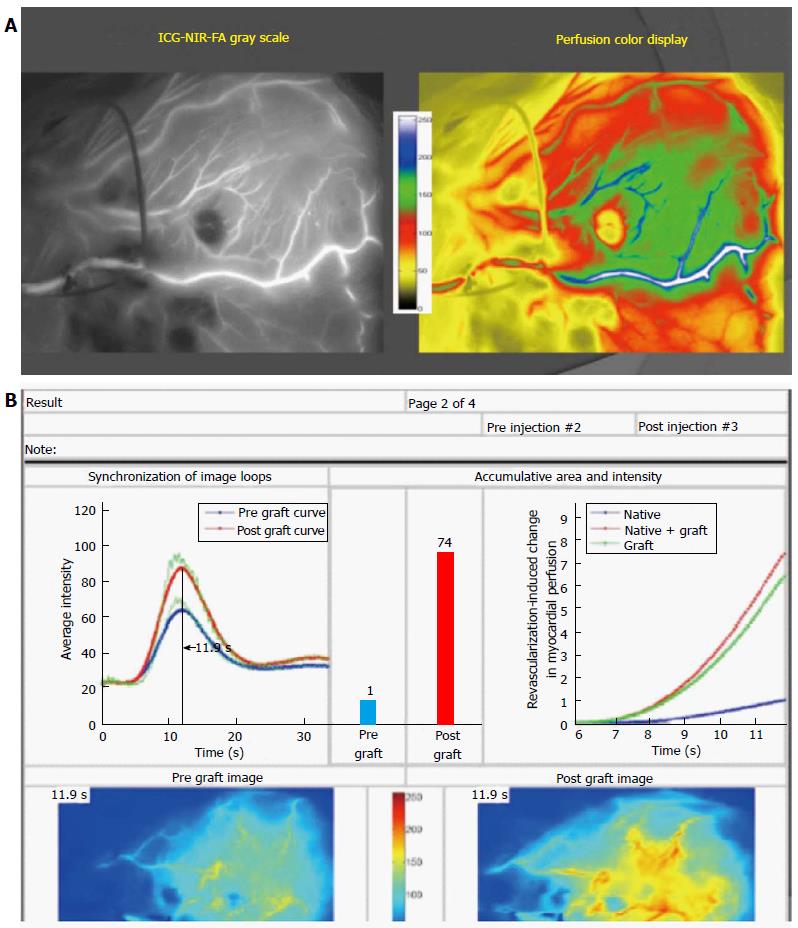
Figure 4 SPY near-infrared imaging of the physiology of revascularization and quantification of the change in regional myocardial perfusion as a result of bypass grafting.
A: Near-infrared frame from 34-s video of IMA graft to LAD in 256 grey scale (left panel) and more intuitive color scale (see color bar) to differentiate perfusion differences to the myocardium. The video shows the dynamic arterial and microvascular blood flow interaction between the native TVECA flow and the IMA graft flow in real-time and under true physiologic conditions; B: The Complex Angiography and Perfusion Analysis platform result from and IMA to LAD graft in a patient with prior anterior MI and regional myocardial ischemia preoperatively. The right upper panel quantitatively compares pre-bypass TVECA regional myocardial perfusion (blue line and bar) with post-bypass combination of TVECA + IMA perfusion (red line and bar). The green line in the graph is the relative contribution to perfusion of the IMA graft flow. The two bottom images are synchronized with respect to timing, as shown by the marker on the upper left graph. This patient with anterior ischemia had a 7-fold increase in perfusion to the anterior regional myocardium as a result of IMA grafting. In addition, the proximal LAD in this patient was 100% occluded, and the pre-grafting TVECA perfusion was entirely from flow through lateral and inferior collaterals. IMA: Internal mammary artery; LAD: Left anterior descending coronary artery; TVECA: Target vessel epicardial coronary artery.
- Citation: Ferguson Jr TB. Physiology of in-situ arterial revascularization in coronary artery bypass grafting: Preoperative, intraoperative and postoperative factors and influences. World J Cardiol 2016; 8(11): 623-637
- URL: https://www.wjgnet.com/1949-8462/full/v8/i11/623.htm
- DOI: https://dx.doi.org/10.4330/wjc.v8.i11.623


