Copyright
©The Author(s) 2015.
World J Cardiol. Oct 26, 2015; 7(10): 671-684
Published online Oct 26, 2015. doi: 10.4330/wjc.v7.i10.671
Published online Oct 26, 2015. doi: 10.4330/wjc.v7.i10.671
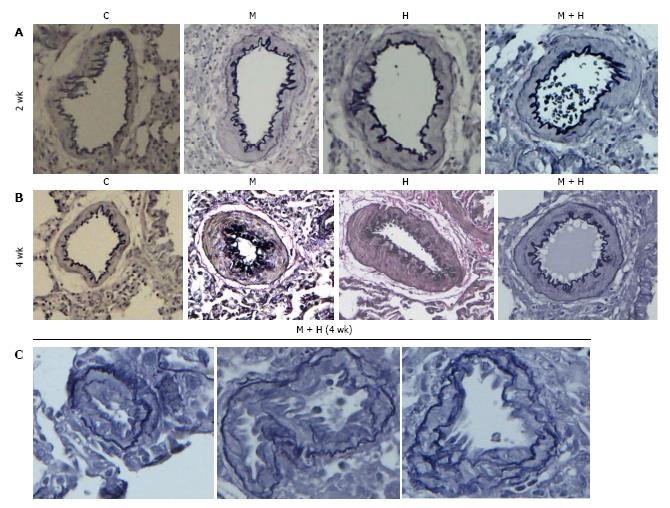
Figure 2 Pulmonary arteries (experimental groups).
A and B: Pulmonary arteries (size 200-317 μm) from the controls and different experimental groups (elastic van Gieson stain): At 2 and 4 wk, arteries from MCT (M), hypoxia (H) and MCT + hypoxia (M + H) exhibit increased medial wall thickening compared with the control (C). Magnification = × 100; C: Arteries (size 100-155 μm) from 4 wk M + H group showing the presence of neointima. Fragmentation of internal elastic lamina can be seen in these arteries. Magnification = × 400.
- Citation: Huang J, Wolk JH, Gewitz MH, Loyd JE, West J, Austin ED, Mathew R. Enhanced caveolin-1 expression in smooth muscle cells: Possible prelude to neointima formation. World J Cardiol 2015; 7(10): 671-684
- URL: https://www.wjgnet.com/1949-8462/full/v7/i10/671.htm
- DOI: https://dx.doi.org/10.4330/wjc.v7.i10.671


