Copyright
©2014 Baishideng Publishing Group Inc.
World J Cardiol. Sep 26, 2014; 6(9): 959-967
Published online Sep 26, 2014. doi: 10.4330/wjc.v6.i9.959
Published online Sep 26, 2014. doi: 10.4330/wjc.v6.i9.959
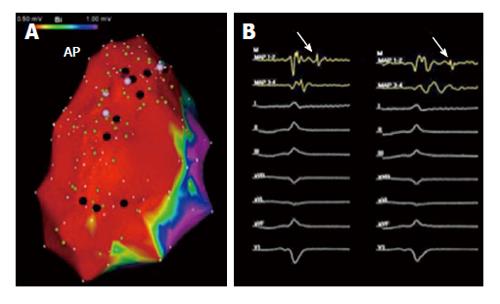
Figure 3 Epicardial right ventricle bipolar voltage map and isolated late potentials in sinus rhythm.
A: Demonstrates significant epicardial bipolar voltage abnormalities (< 1.0 mV) over the right ventricle free wall. The black tags on the electroanatomical map represent areas of abnormal fractionated and/or late signals identified during sinus rhythm voltage mapping; B: Provides an example, as exhibited by the white arrows, of an isolated late potential. AP: Anterior.
- Citation: Tschabrunn CM, Marchlinski FE. Ventricular tachycardia mapping and ablation in arrhythmogenic right ventricular cardiomyopathy/dysplasia: Lessons Learned. World J Cardiol 2014; 6(9): 959-967
- URL: https://www.wjgnet.com/1949-8462/full/v6/i9/959.htm
- DOI: https://dx.doi.org/10.4330/wjc.v6.i9.959


