Copyright
©2014 Baishideng Publishing Group Inc.
World J Cardiol. Nov 26, 2014; 6(11): 1192-1208
Published online Nov 26, 2014. doi: 10.4330/wjc.v6.i11.1192
Published online Nov 26, 2014. doi: 10.4330/wjc.v6.i11.1192
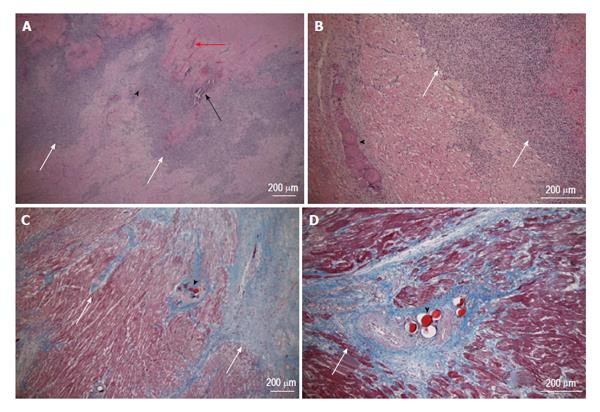
Figure 9 Acute (top row, hematoxylin and eosin stain) and chronic (bottom row, Masson trichrome stain) patchy microinfarct (white arrows) and microemboli (black arrowhead) distribution between viable myocardium at 3 d and 5 wk after embolization, respectively.
Intramyocardial hemorrhage (red arrow) and calcium deposition (black arrow) are evident at 3 d on HE stain, but not at 5 wk. The magnifications are 40 × (A and C) and 100 × (B and D).
- Citation: Saeed M, Hetts SW, Jablonowski R, Wilson MW. Magnetic resonance imaging and multi-detector computed tomography assessment of extracellular compartment in ischemic and non-ischemic myocardial pathologies. World J Cardiol 2014; 6(11): 1192-1208
- URL: https://www.wjgnet.com/1949-8462/full/v6/i11/1192.htm
- DOI: https://dx.doi.org/10.4330/wjc.v6.i11.1192


