Copyright
©2013 Baishideng Publishing Group Co.
World J Cardiol. May 26, 2013; 5(5): 132-140
Published online May 26, 2013. doi: 10.4330/wjc.v5.i5.132
Published online May 26, 2013. doi: 10.4330/wjc.v5.i5.132
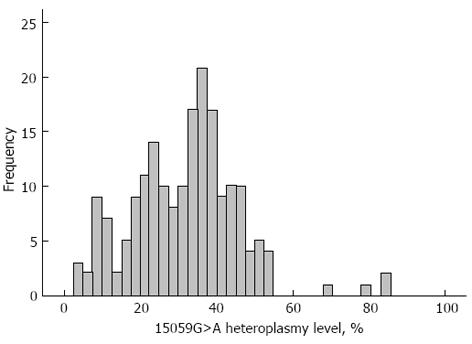
Figure 1 A frequency distribution histogram of the mtDNA 15059 G>A mutation heteroplasmy level in 191 studied individuals.
The bell-shaped curve represents the expected normal frequency distribution of the mutated allele.
- Citation: Sobenin IA, Chistiakov DA, Sazonova MA, Ivanova MM, Bobryshev YV, Orekhov AN, Postnov AY. Association of the level of heteroplasmy of the 15059G>A mutation in the MT-CYB mitochondrial gene with essential hypertension. World J Cardiol 2013; 5(5): 132-140
- URL: https://www.wjgnet.com/1949-8462/full/v5/i5/132.htm
- DOI: https://dx.doi.org/10.4330/wjc.v5.i5.132


