
















©2012 Baishideng Publishing Group Co.
World J Cardiol. Apr 26, 2012; 4(4): 103-111
Published online Apr 26, 2012. doi: 10.4330/wjc.v4.i4.103
Published online Apr 26, 2012. doi: 10.4330/wjc.v4.i4.103
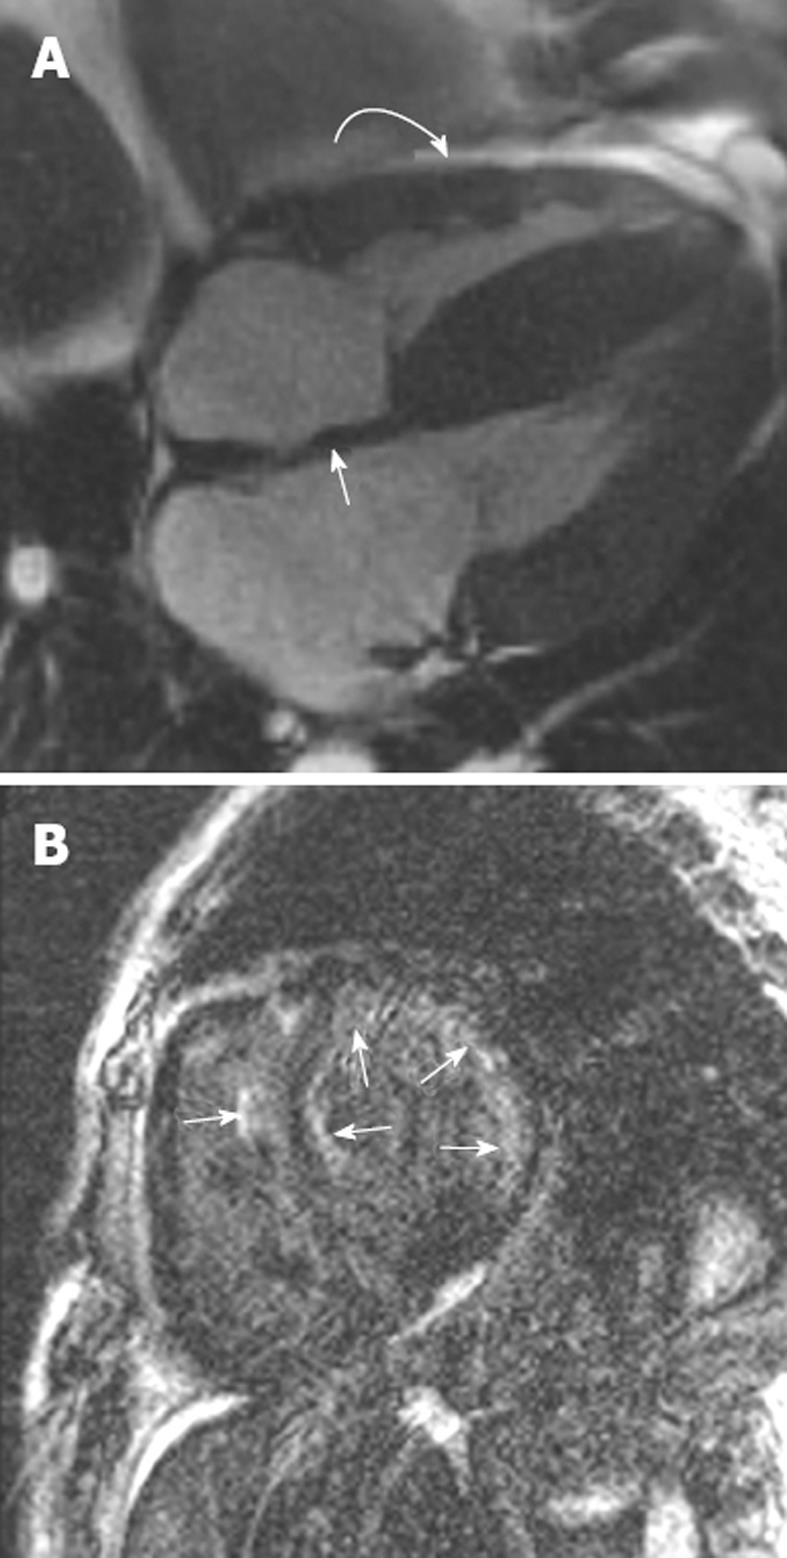
Figure 5 Right ventricular endomyocardial biopsy showed cardiac amyloid.
A: Horizontal long axis steady-state free precession sequence showing hypertrophy of the basal segments of the left ventricle (straight arrow), and bi-atrial enlargement and thickening of the interatrial septum (curved arrow). Note the small pericardial effusion; B: Late-enhanced sequence shows a circumferential subendocardial high signal. Note the high signal on the right ventricular side of the interventricular septum resulting in the tram track sign (arrow). Note also the small pericardial effusion.
- Citation: McDermott S, O’Neill AC, Ridge CA, Dodd JD. Investigation of cardiomyopathy using cardiac magnetic resonance imaging part 1: Common phenotypes. World J Cardiol 2012; 4(4): 103-111
- URL: https://www.wjgnet.com/1949-8462/full/v4/i4/103.htm
- DOI: https://dx.doi.org/10.4330/wjc.v4.i4.103