
















©2010 Baishideng Publishing Group Co.
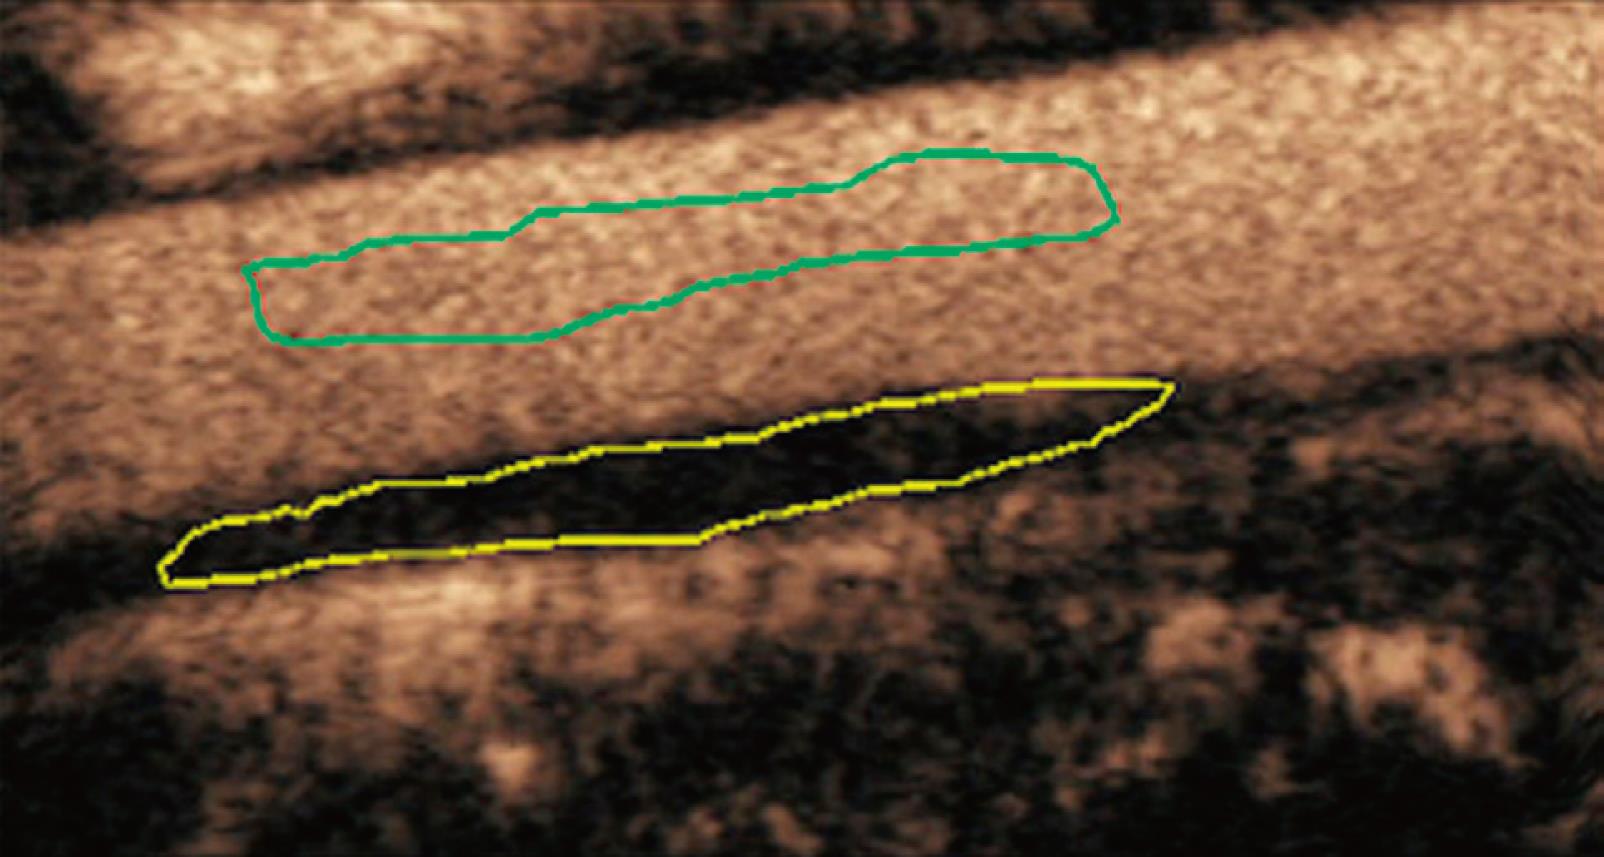
Figure 2 ROI (yellow) was drawn freehand around the peripheral margin of the plaque.
The arrival time (AT), time to peak enhancement (TTP), goodness of fit (GOF), baseline intensity (BI) and peak intensity (PI) of plaque were calculated automatically by the ACQ software. IE = PI - BI, WT = TTP - AT.
- Citation: Huang PT, Chen CC, Aronow WS, Wang XT, Nair CK, Xue NY, Shen X, Li SY, Huang FG, Cosgrove D. Assessment of neovascularization within carotid plaques in patients with ischemic stroke. World J Cardiol 2010; 2(4): 89-97
- URL: https://www.wjgnet.com/1949-8462/full/v2/i4/89.htm
- DOI: https://dx.doi.org/10.4330/wjc.v2.i4.89