
















Copyright: ©Author(s) 2026.
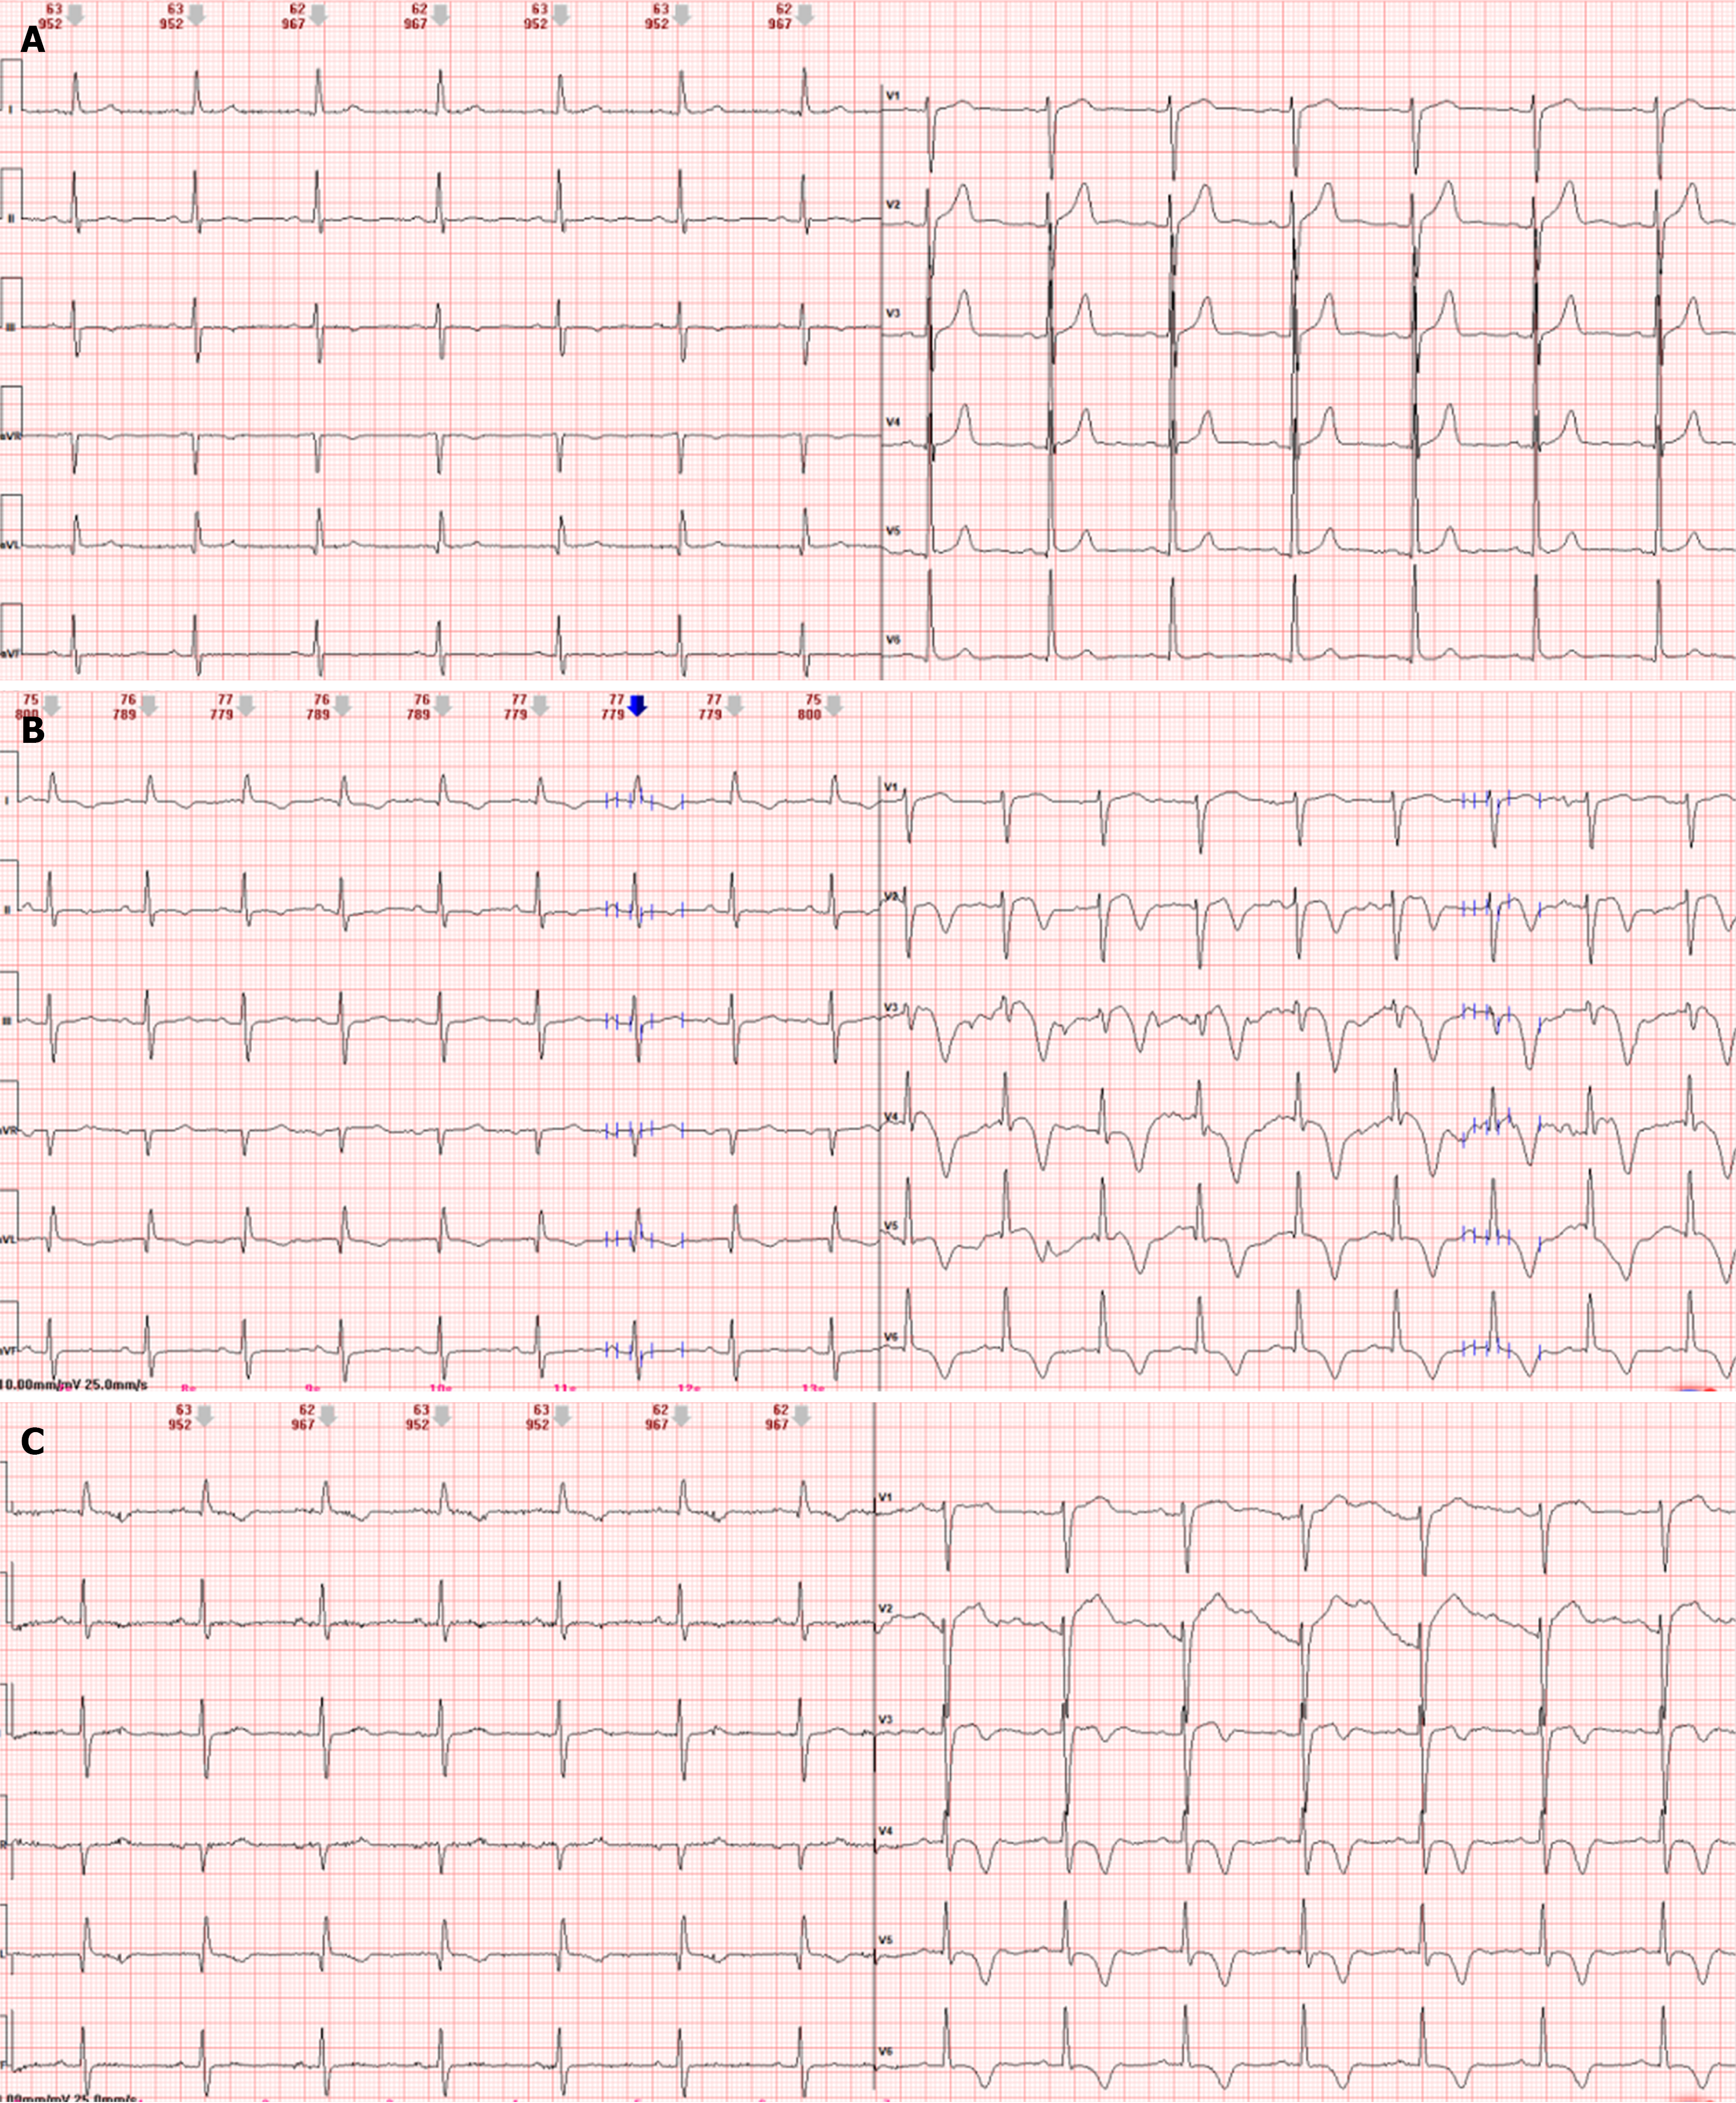
Figure 3 Serial electrocardiogram changes.
A: Admission electrocardiogram (ECG): Pseudonormalization of T waves in V2-V4; B: ECG during recurrent angina: New ST depression and deep T-wave inversions in V2-V6, confirming active ischemia; C: Post-procedural 12-lead electrocardiogram of second percutaneous coronary intervention showing significant recovery of T-waves in leads V2-V6, suggesting improved myocardial reperfusion.
- Citation: Huang D, Li RZ, Chen HM, He B, Yan W, Li KL, Long M. Stent balloon fracture, endarterectomy, and lithotripsy balloon rupture following percutaneous coronary intervention: A case report. World J Cardiol 2026; 18(8): 124678
- URL: https://www.wjgnet.com/1949-8462/full/v18/i8/124678.htm
- DOI: https://dx.doi.org/10.4330/wjc.124678