
















Copyright: ©Author(s) 2026.
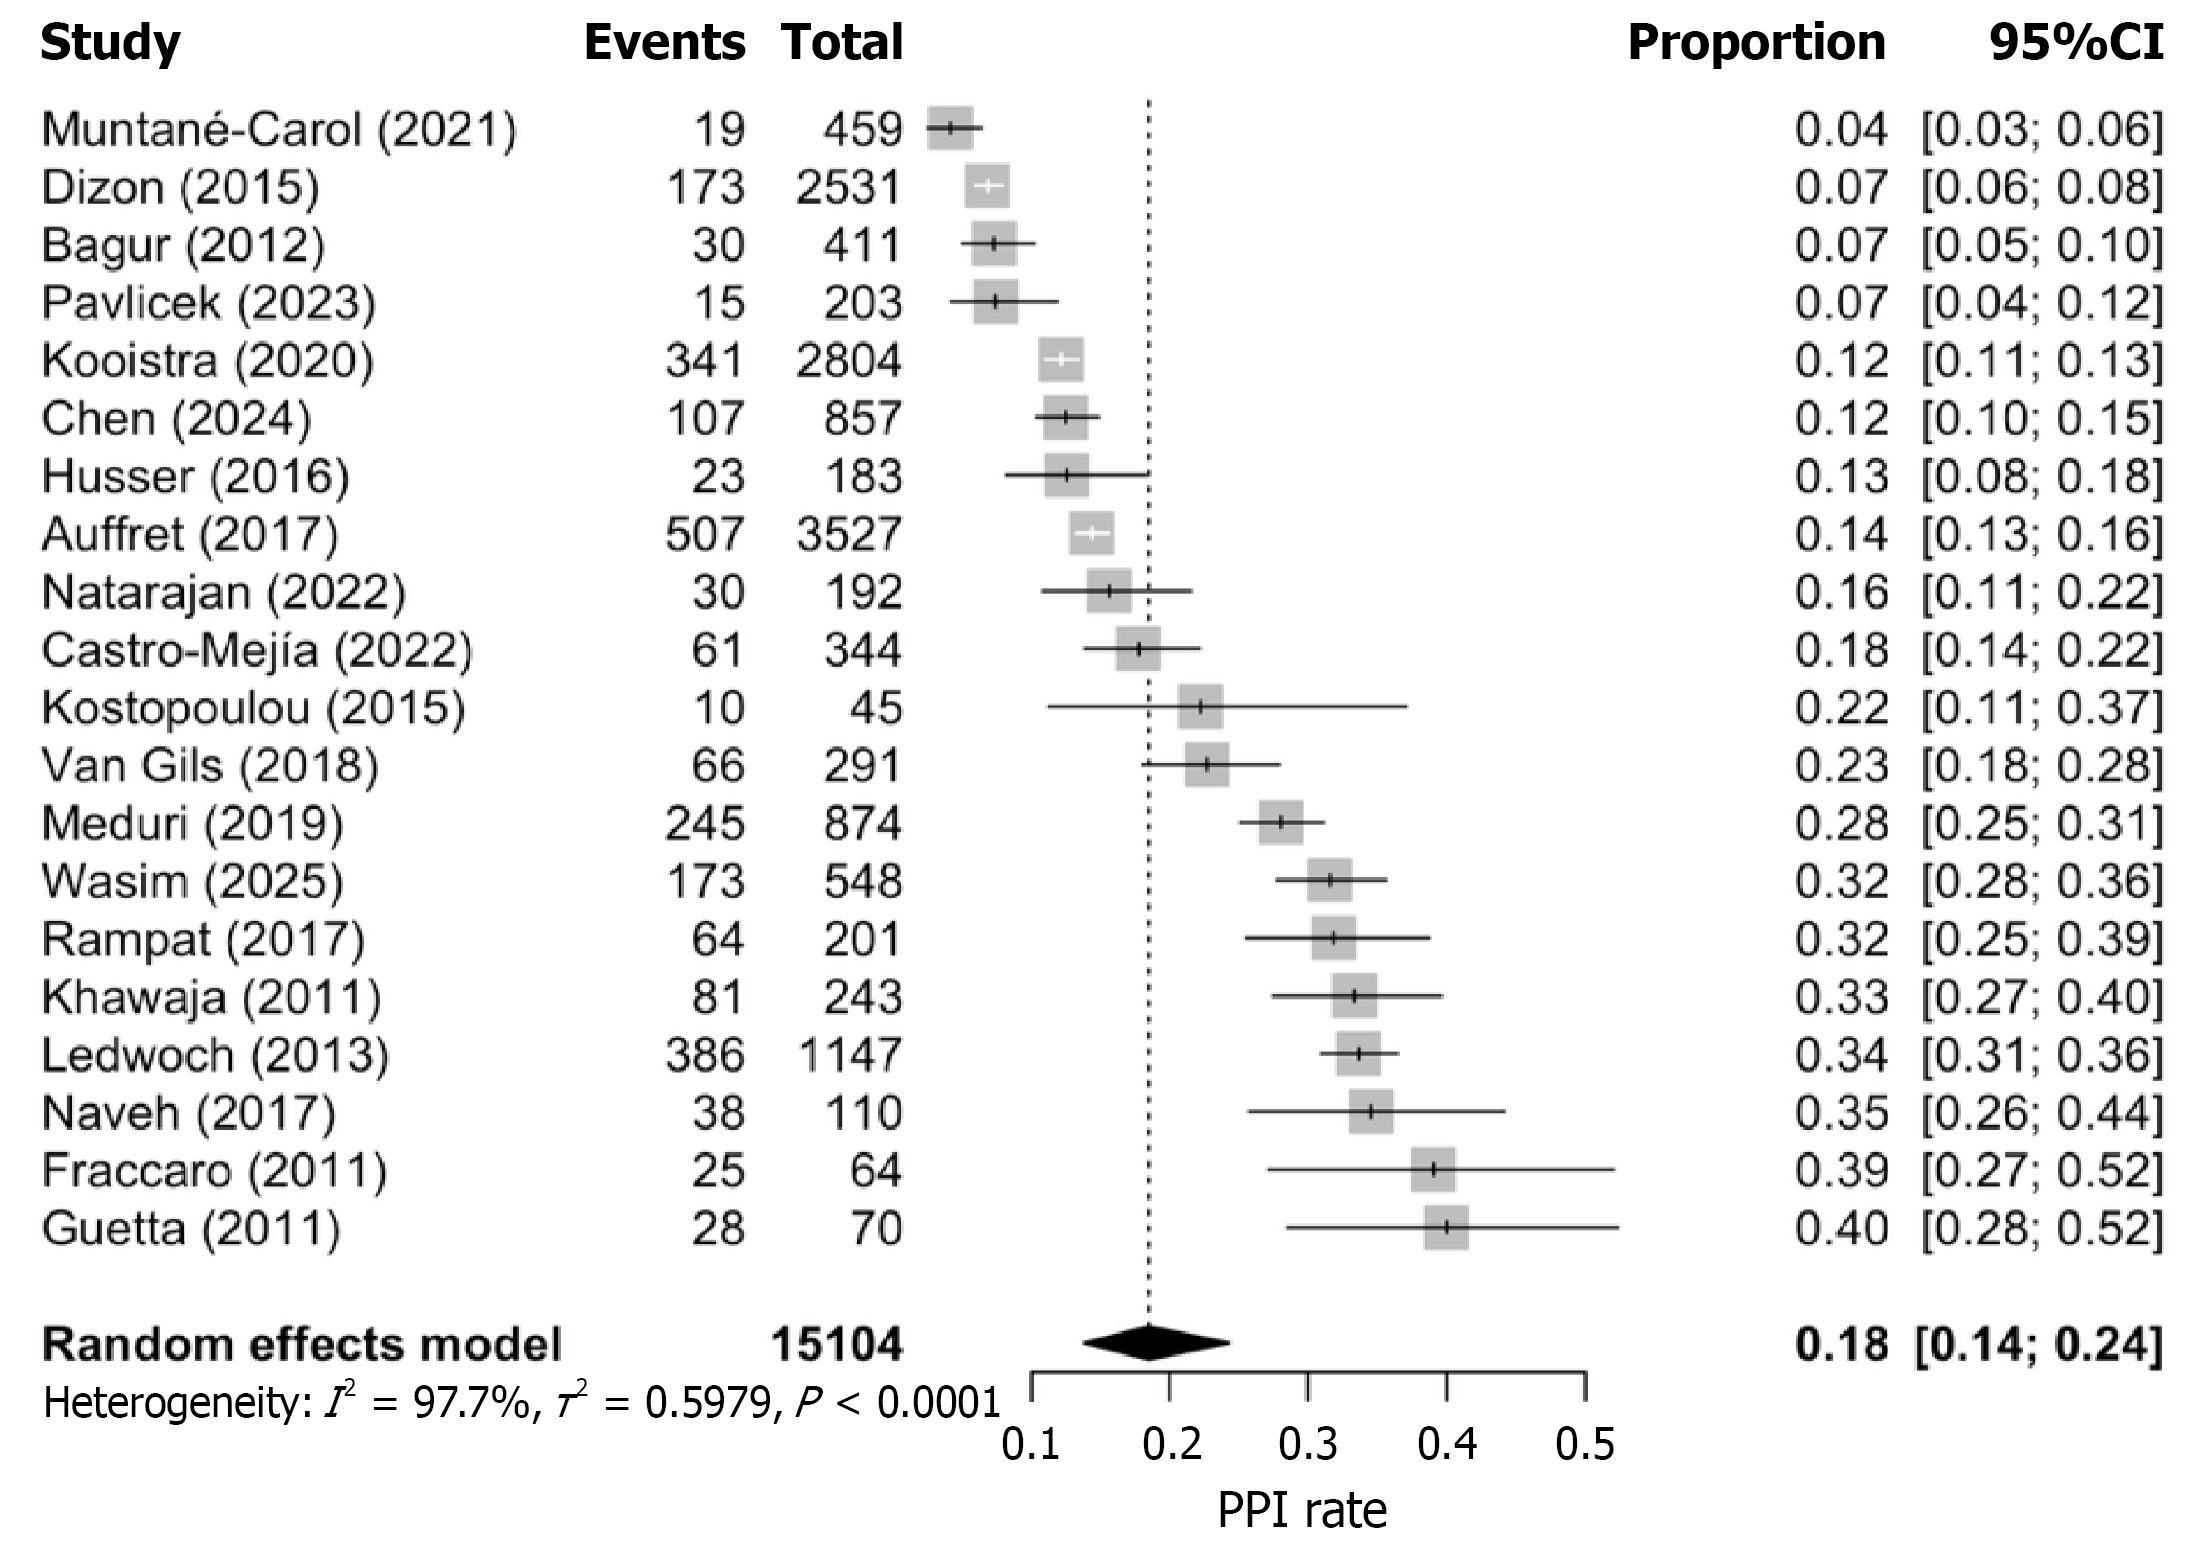
Figure 3 Forest plot depicting pooled incidence of new permanent pacemaker implantation following transcatheter aortic valve replacement across 20 studies (n = 15104) using an updated generalized linear mixed model analysis on the logit scale.
Pooled proportion 0.18 (95%CI: 0.14-0.24); I2 = 97.7%, indicating substantial heterogeneity attributable to differences in valve platform, implantation era, and pacing protocols. Each row represents one study; square size reflects study weight; diamond represents pooled estimate. PPI: Permanent pacemaker implantation.
- Citation: Fuchs TK, Jones C, Patterson JB. Impact of pre-existing conduction abnormalities on permanent pacemaker implantation after transcatheter aortic valve replacement: A meta-analysis. World J Cardiol 2026; 18(8): 123559
- URL: https://www.wjgnet.com/1949-8462/full/v18/i8/123559.htm
- DOI: https://dx.doi.org/10.4330/wjc.123559