
















Copyright: ©Author(s) 2026.
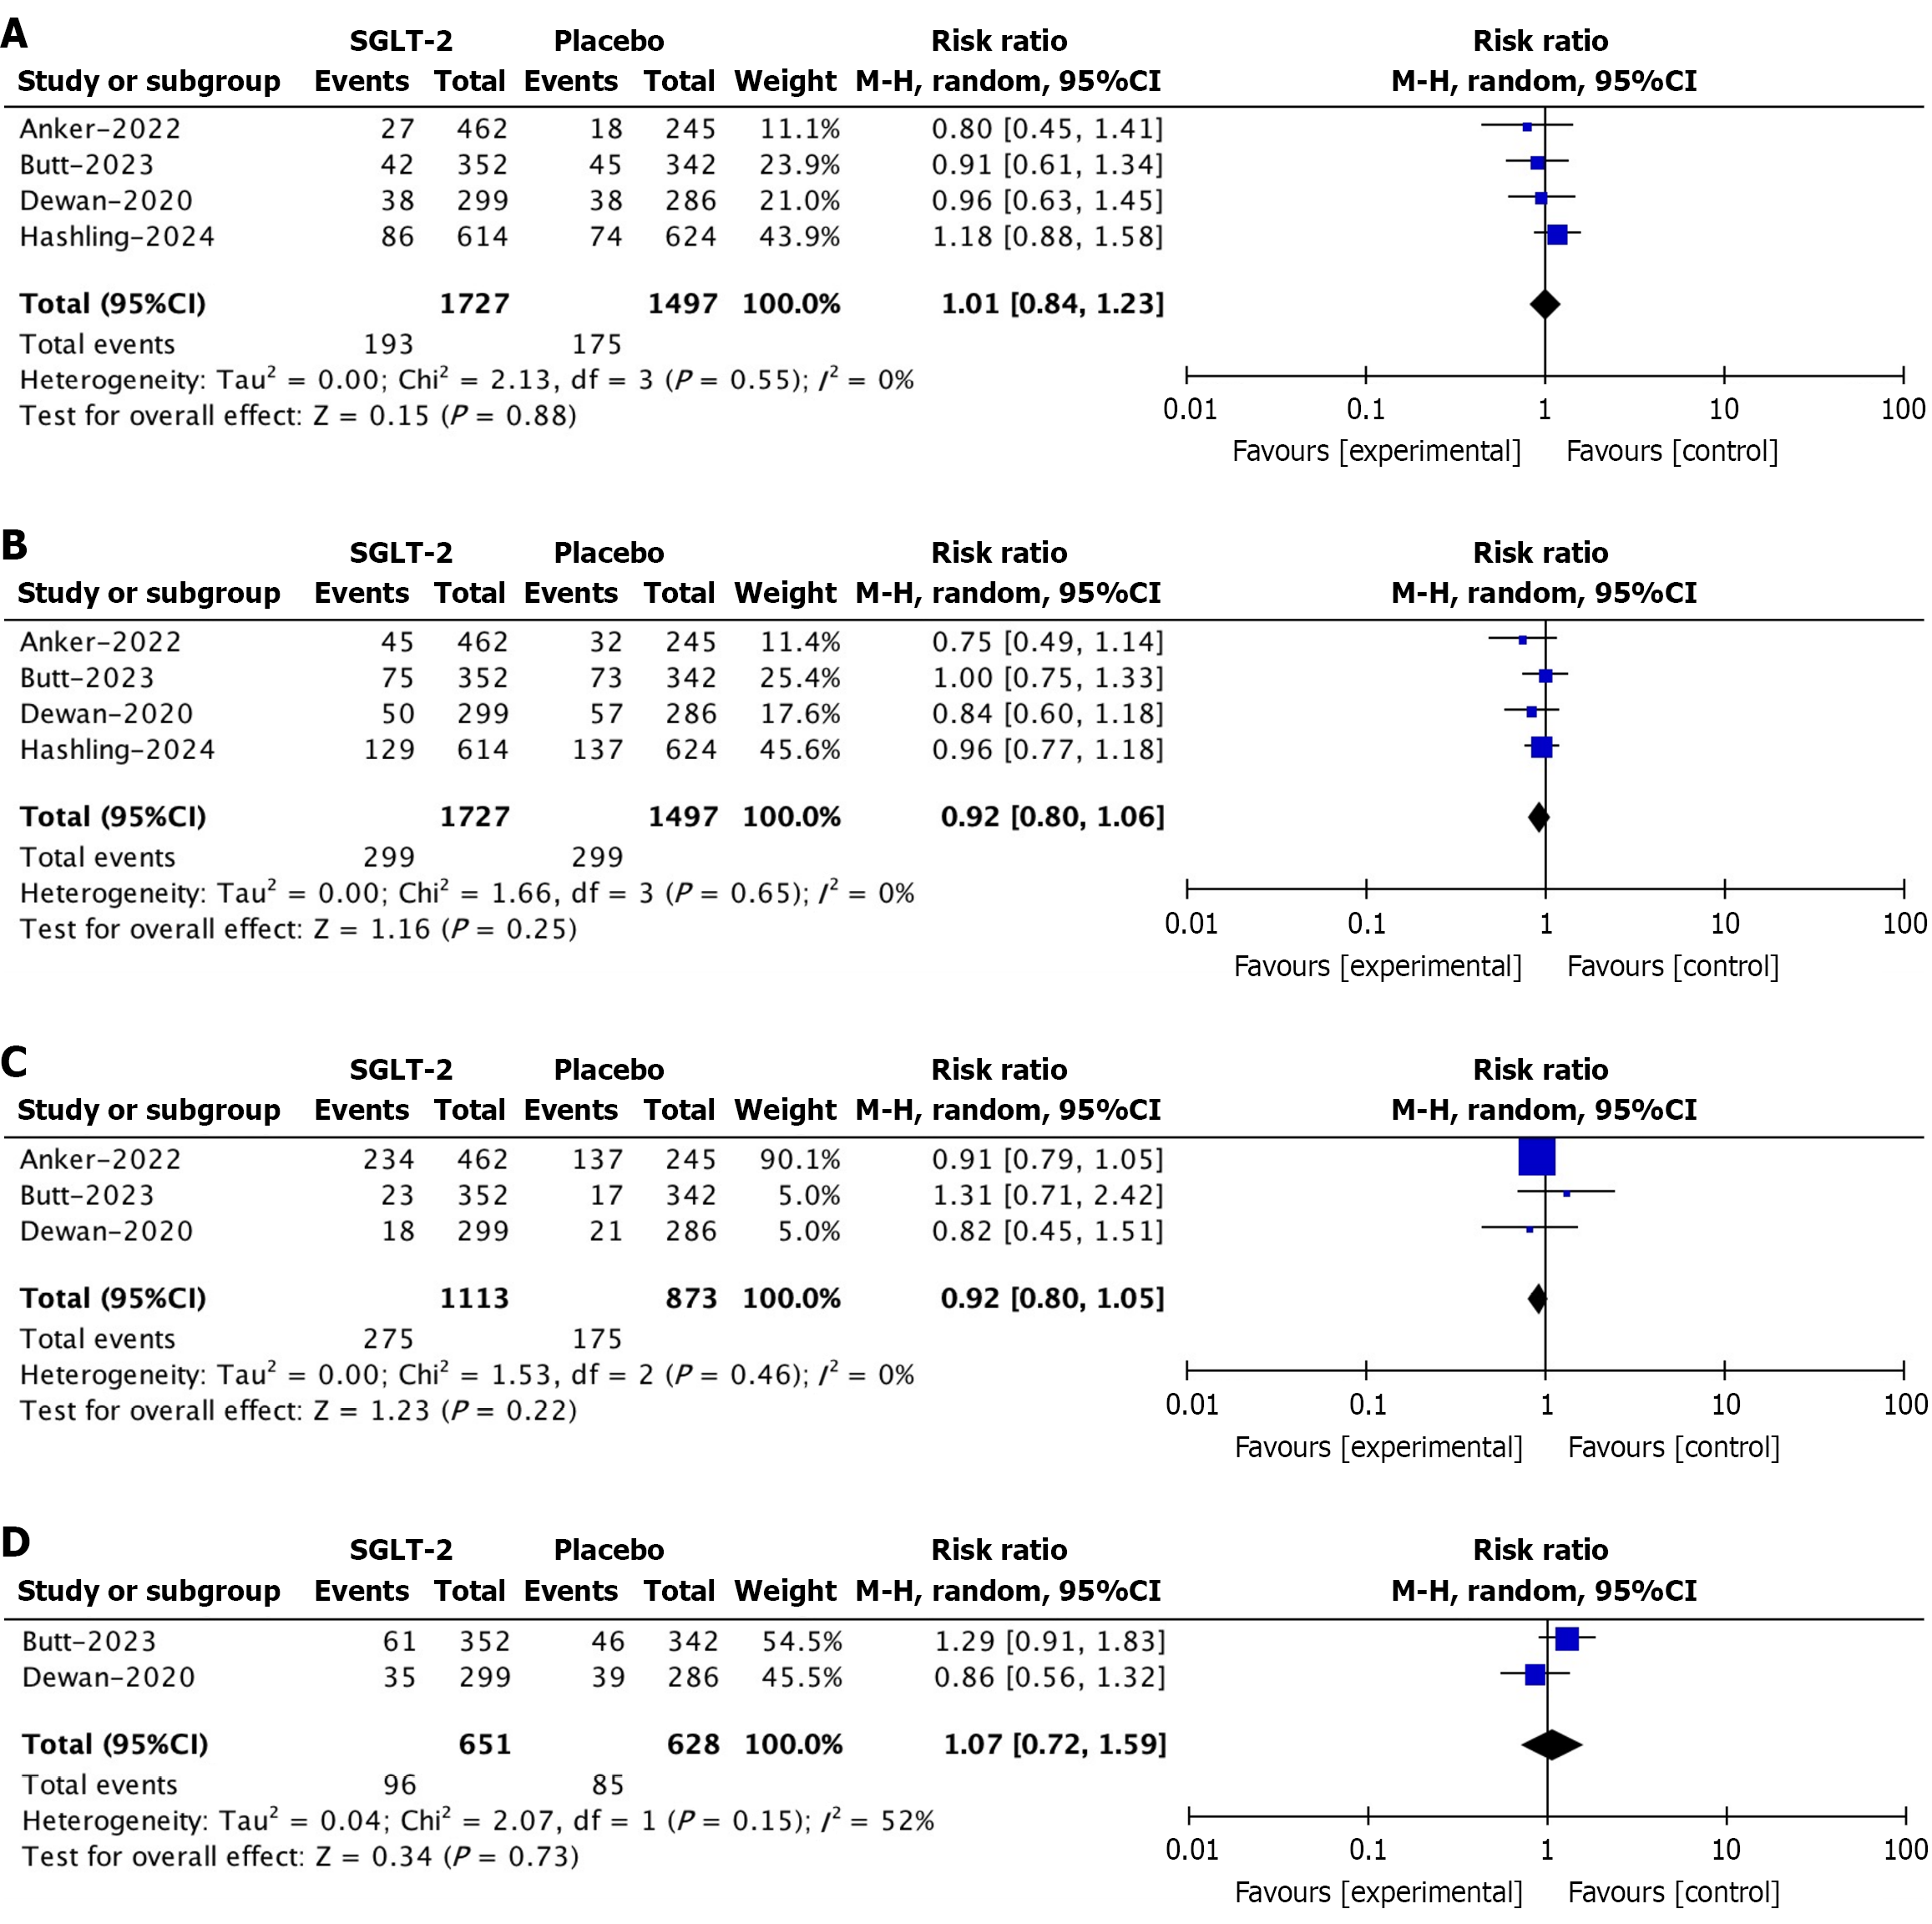
Figure 4 Forest plot comparison of cardiovascular death, all-cause mortality, adverse events, and drug discontinuation.
A: Forest plot comparison of cardiovascular death; B: Forest plot comparison of all-cause mortality; C: Forest plot comparison of adverse events; D: Forest plot comparison of drug discontinuation. SGLT-2: Sodium-glucose co-transporter-2.
- Citation: Khan ZA, Sohail R, Khattak R, Patel V, Alberto Jr M, Anand P, Feldiorean A, Georgy M, Valdiviez LM, Poldneff D, Khan Z, Murtaza I, Curry S. Cardiovascular outcomes of sodium-glucose co-transporter-2 inhibitors in heart failure and coexisting chronic obstructive pulmonary disease: A meta-analysis. World J Cardiol 2026; 18(6): 119509
- URL: https://www.wjgnet.com/1949-8462/full/v18/i6/119509.htm
- DOI: https://dx.doi.org/10.4330/wjc.119509