
















Copyright: ©Author(s) 2026.
World J Cardiol. Apr 26, 2026; 18(4): 117929
Published online Apr 26, 2026. doi: 10.4330/wjc.v18.i4.117929
Published online Apr 26, 2026. doi: 10.4330/wjc.v18.i4.117929
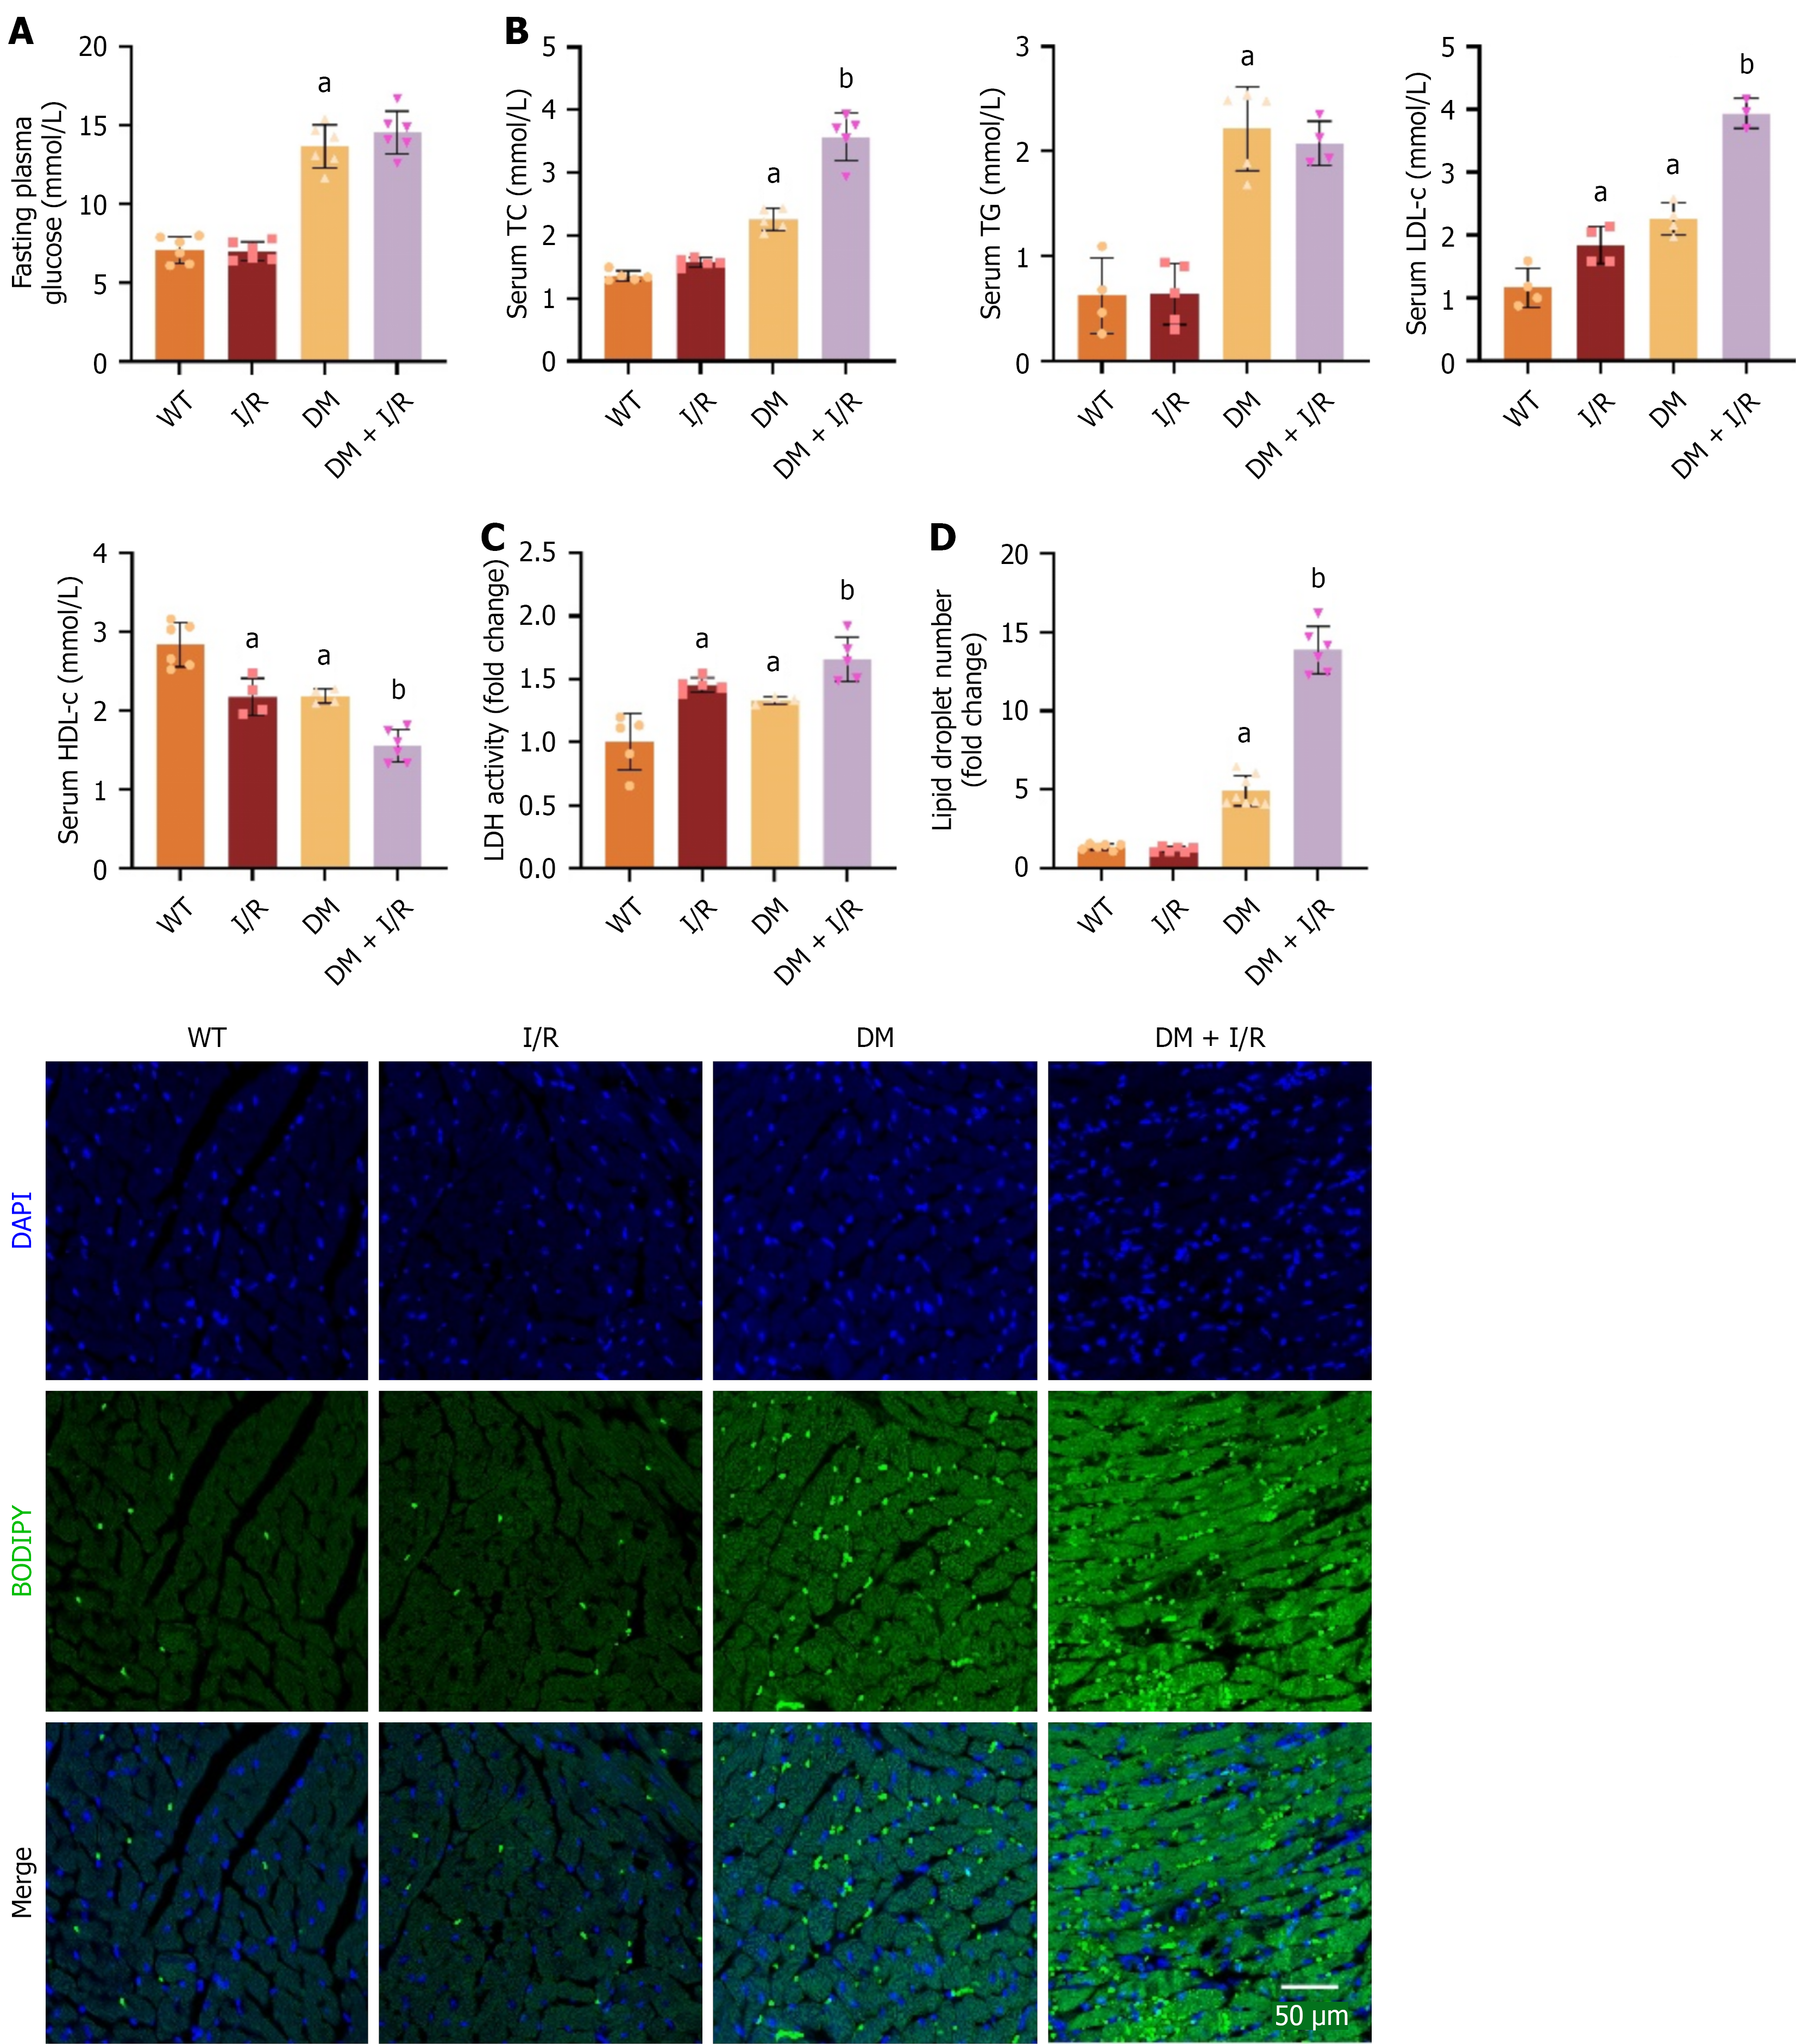
Figure 2 Diabetes mellitus with ischemia-reperfusion mice exhibited severe glucose and lipid metabolism disorders.
A: Statistical analysis of fasting blood glucose; B: The content of total cholesterol, triglycerides, low-density lipoprotein, high-density lipoprotein in serum; C: The activity of lactate dehydrogenase in serum; D: Representative images of BODIPY 493/503 staining of myocardial tissue and statistical graph. Above results are presented as the mean ± SD. The comparison between more groups was conducted by one-way analysis of variance. aP < 0.05 vs the wild type group; bP < 0.05 vs the diabetes mellitus group. WT: Wild type; I/R: Ischemia-reperfusion; DM: Diabetes mellitus; LDH-c: Lactate dehydrogenase cholesterol; LDL-c: Low-density lipoprotein cholesterol; TC: Total cholesterol; TG: Triglyceride.
- Citation: Yang X, Zhao YT, Liu H, Wang RX, Wu LY, Ye HW, Wen Y, Wang JX, Yu MX, Ma CX, Zhang XF, Wang LH. Daming capsule combined with SGLT2i confers protection against diabetes with myocardial ischemia/reperfusion injury induced ferroptosis via AMPK. World J Cardiol 2026; 18(4): 117929
- URL: https://www.wjgnet.com/1949-8462/full/v18/i4/117929.htm
- DOI: https://dx.doi.org/10.4330/wjc.v18.i4.117929