
















Copyright: ©Author(s) 2026.
World J Cardiol. Apr 26, 2026; 18(4): 116033
Published online Apr 26, 2026. doi: 10.4330/wjc.v18.i4.116033
Published online Apr 26, 2026. doi: 10.4330/wjc.v18.i4.116033
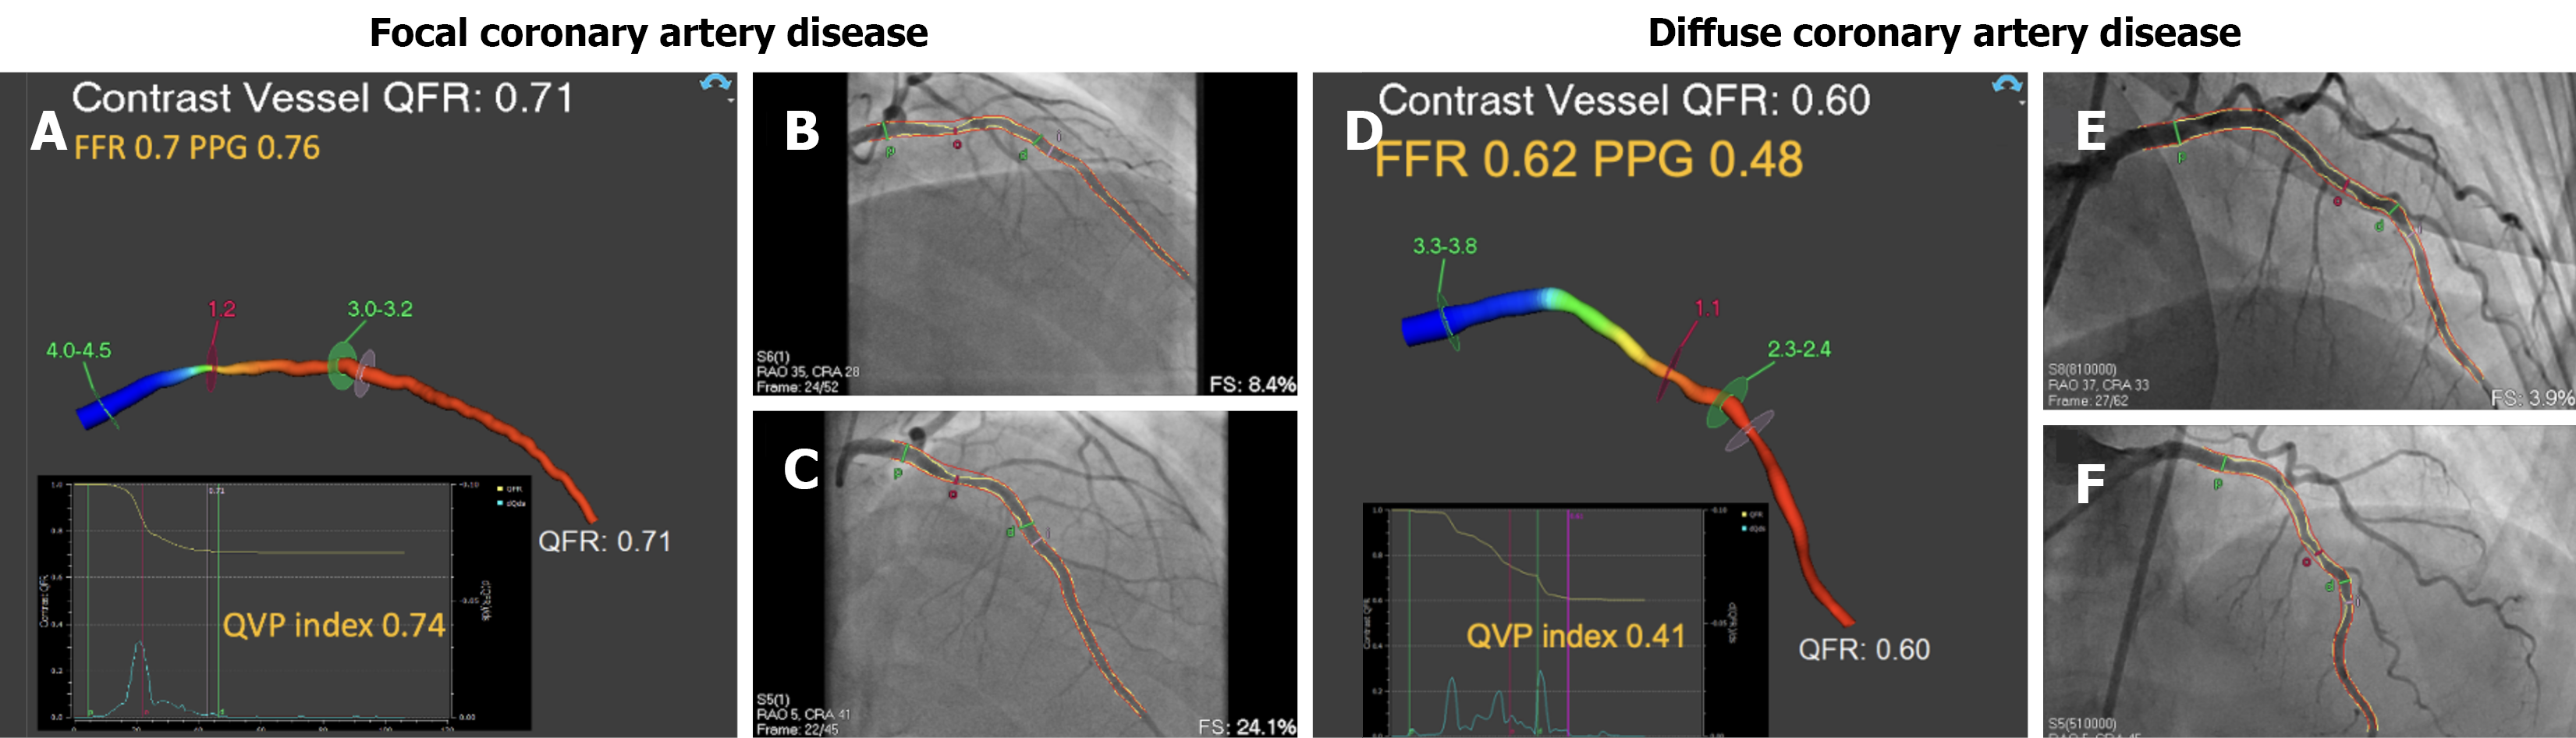
Figure 2 Examples of focal and diffuse coronary artery disease.
A: It shows a 3-dimensional reconstructed left anterior descending artery (LAD) with the quantitative flow ratio (QFR)-derived pullback curve [QFR virtual pullback (QVP) index] displayed in the bottom left. In this case, the fractional flow reserve and QFR values were 0.70 and 0.71 while the pressure pullback gradient and QVP index were 0.76 and 0.74 respectively suggestive of focal pattern of disease; B and C: They show orthogonal angiographic projections of the LAD with focal disease in the proximal segment; D: It shows a 3-dimensional reconstructed LAD QFR-derived pullback curve (QVP index) displayed in the bottom left. In this case, the fractional flow reserve and QFR values were identical at 0.60 while the pressure pullback gradient and QVP index were 0.48 and 0.41 respectively suggestive of a diffuse pattern of disease; E and F: They show orthogonal angiographic projections of the LAD with diffuse disease in the mid segment. FFR: Fractional flow reserve; PPG: Pressure pullback gradient; QFR: Quantitative flow ratio; QVP: Quantitative flow ratio virtual pullback.
- Citation: Teoh ZH, Wardill T, Zhang M, O’Brien J, Chew DP, Ko B, Wong DTL. Quantitative flow ratio virtual pullback index predicts focal coronary artery disease identified on wire-based pullback pressure gradient. World J Cardiol 2026; 18(4): 116033
- URL: https://www.wjgnet.com/1949-8462/full/v18/i4/116033.htm
- DOI: https://dx.doi.org/10.4330/wjc.v18.i4.116033