
















Copyright: ©Author(s) 2026.
World J Cardiol. Mar 26, 2026; 18(3): 117999
Published online Mar 26, 2026. doi: 10.4330/wjc.v18.i3.117999
Published online Mar 26, 2026. doi: 10.4330/wjc.v18.i3.117999
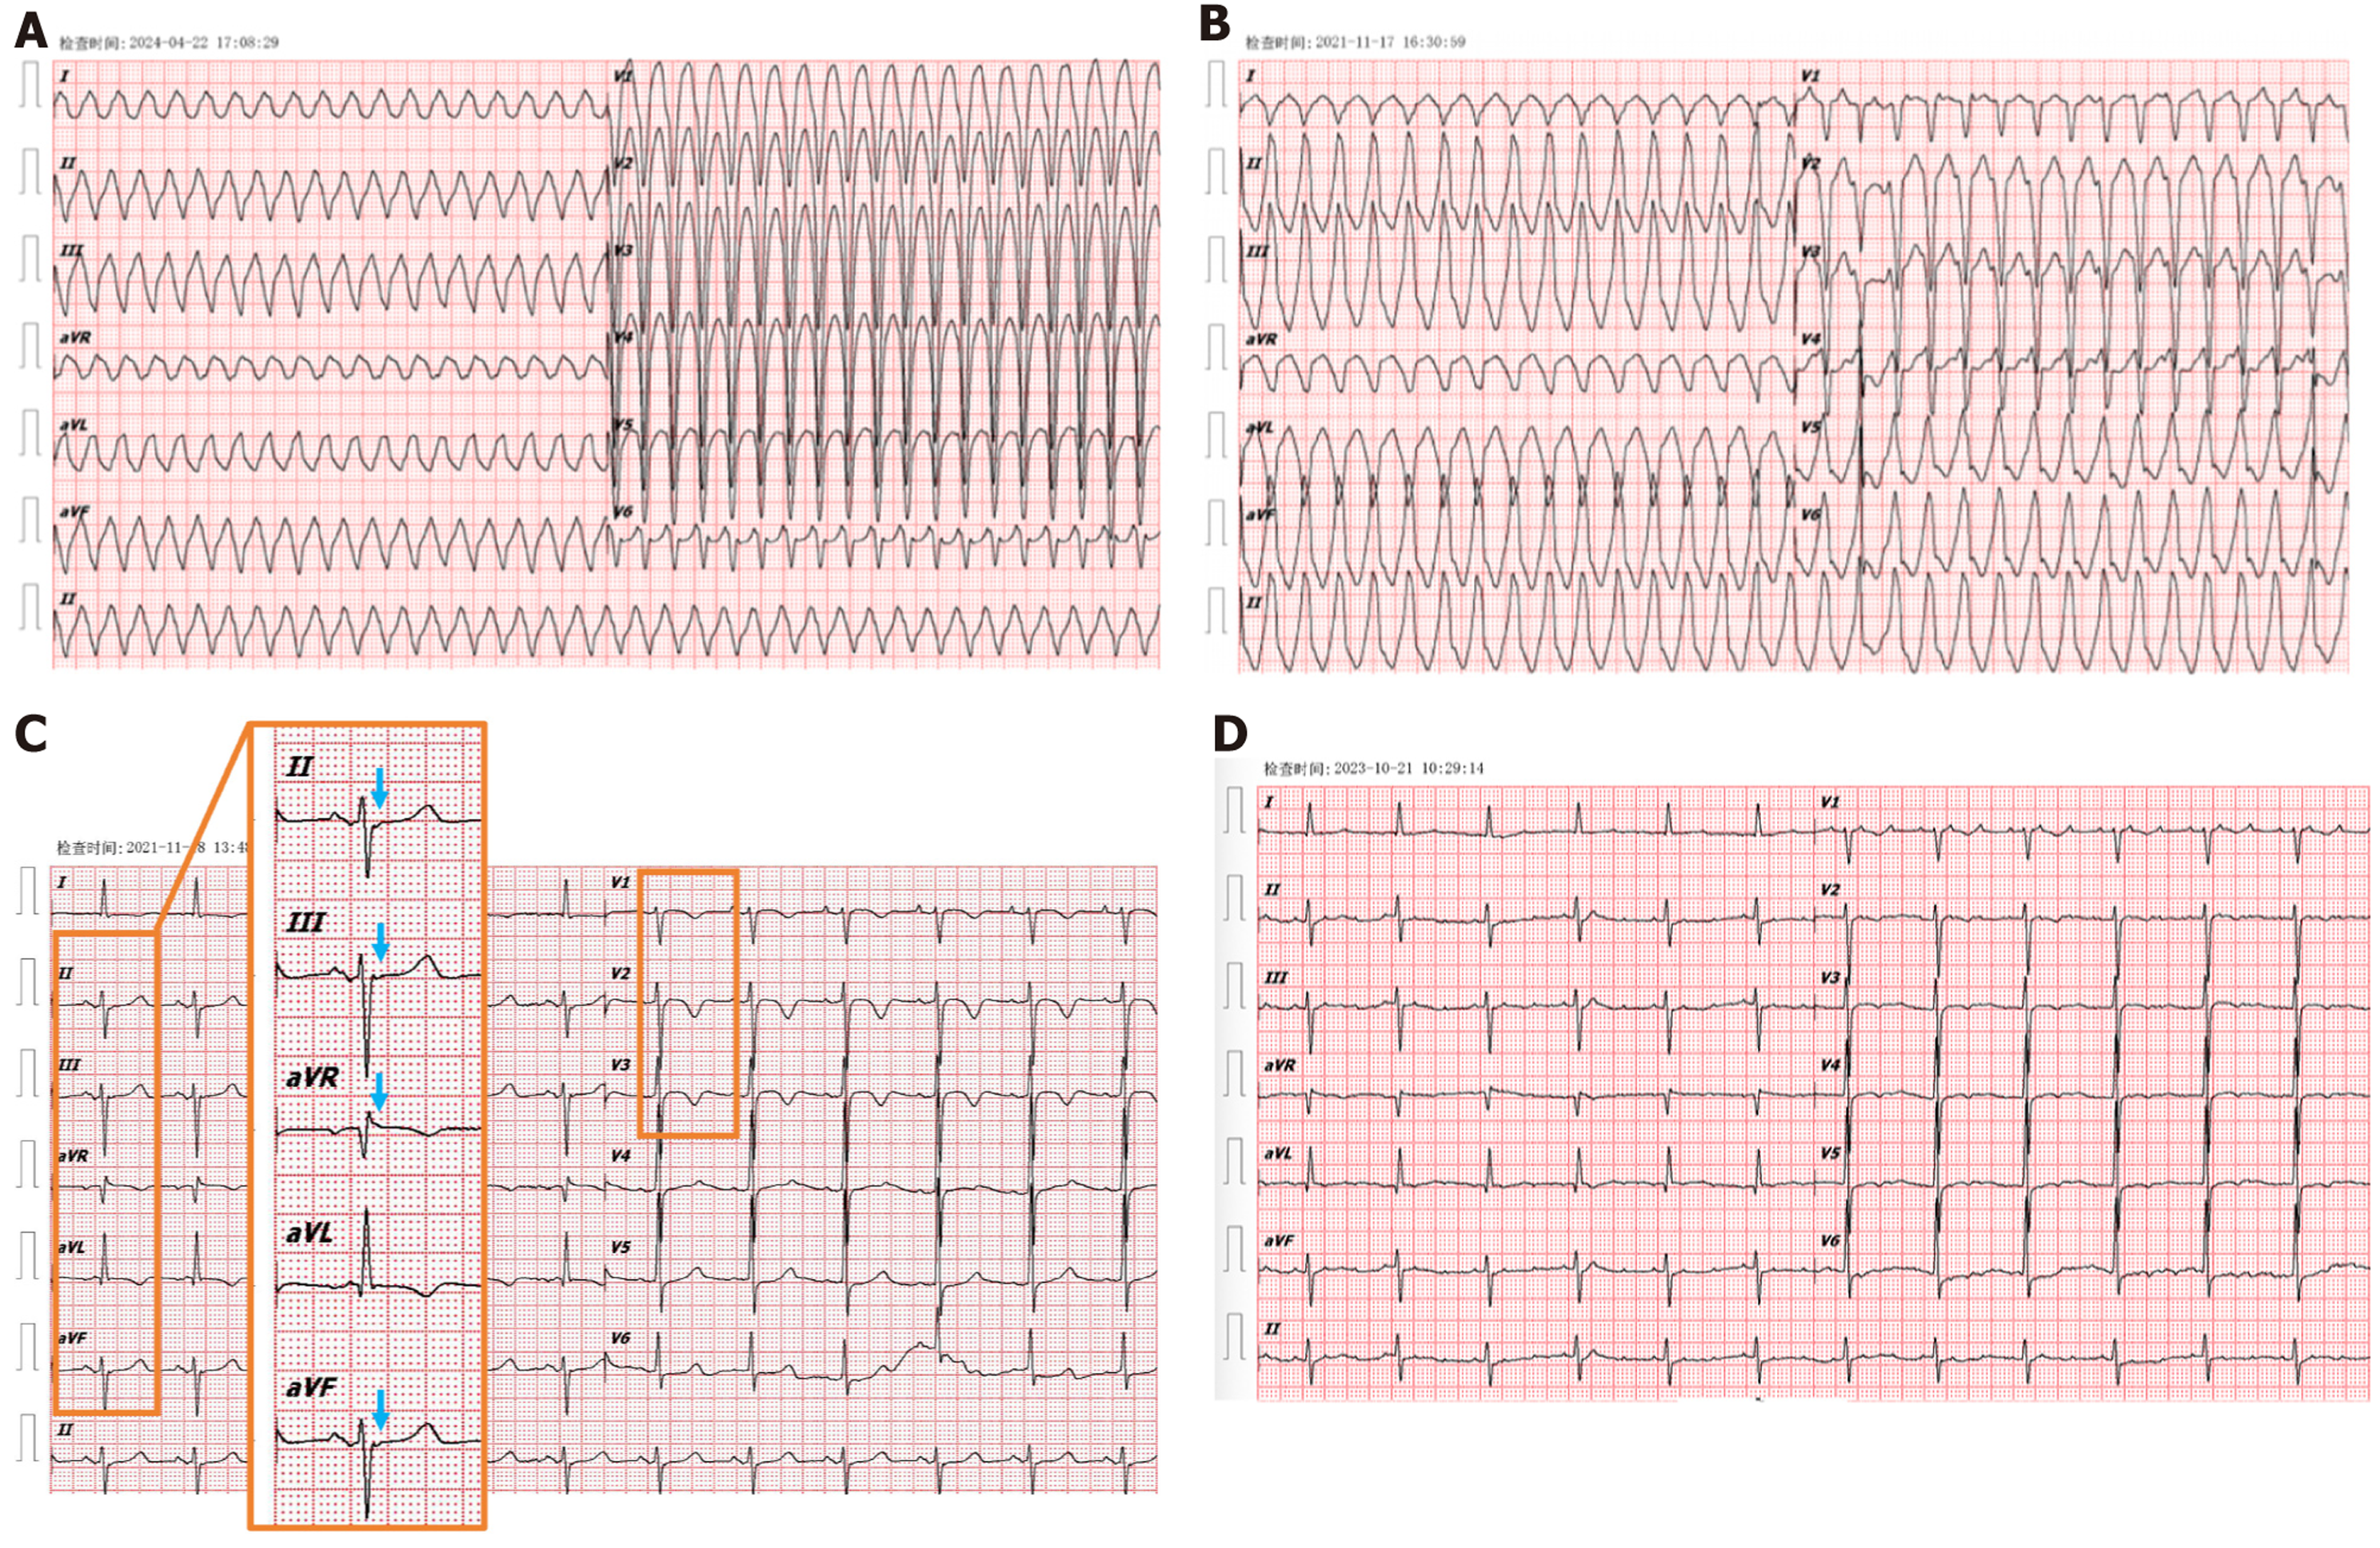
Figure 1 Electrocardiography of the patient.
A: Emergency electrocardiography (ECG) at presentation showing sustained ventricular tachycardia (VT), heart rate 228 bpm; B: Emergency ECG in 2021 showing sustained VT, heart rate 192 bpm; C: Following electrical cardioversion ECG in 2021 showing Epsilon waves in leads II, III (blue arrows), aVR, aVF, inverted T waves in leads V1, V2, V3; D: Admission ECG during hospitalization for ischemic stroke in 2023 showing atrial tachycardia with 2:1 atrioventricular conduction.
- Citation: Li A, Zhu YJ, Ma XX, Jin Y, Yang J, Feng QT. Arrhythmogenic right ventricular cardiomyopathy with atrial tachycardia and sick sinus syndrome: A case report. World J Cardiol 2026; 18(3): 117999
- URL: https://www.wjgnet.com/1949-8462/full/v18/i3/117999.htm
- DOI: https://dx.doi.org/10.4330/wjc.v18.i3.117999