
















Copyright: ©Author(s) 2026.
World J Cardiol. Mar 26, 2026; 18(3): 117821
Published online Mar 26, 2026. doi: 10.4330/wjc.v18.i3.117821
Published online Mar 26, 2026. doi: 10.4330/wjc.v18.i3.117821
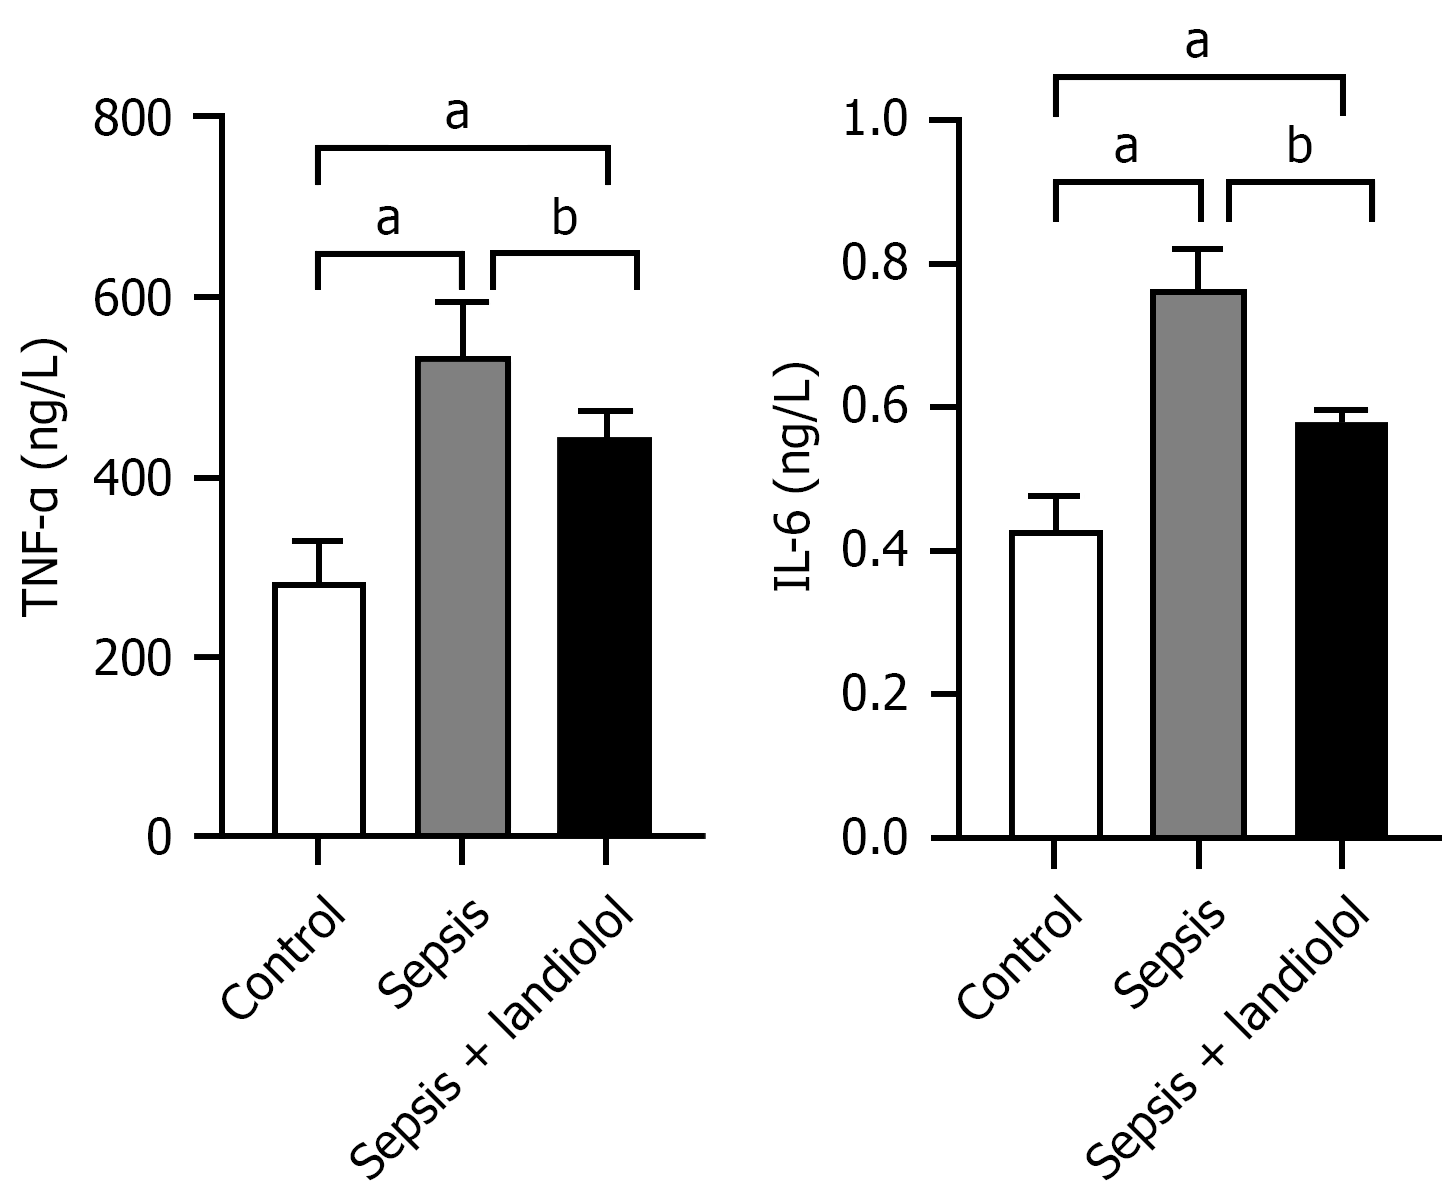
Figure 2 Comparison of tumor necrosis factor-α and interleukin-6 expression levels among the three groups.
aP < 0.05 vs control, bP < 0.05 vs sepsis group, n = 8. TNF-α: Tumor necrosis factor-α; IL-6: Interleukin-6.
- Citation: Hu PF, Bai LY, Zhao M, Ma KY, Xuan LY, Qi X. Landiolol modulates sodium 1.5 ion and connexin-43 to reduce sepsis ventricular arrhythmias. World J Cardiol 2026; 18(3): 117821
- URL: https://www.wjgnet.com/1949-8462/full/v18/i3/117821.htm
- DOI: https://dx.doi.org/10.4330/wjc.v18.i3.117821