
















Copyright: ©Author(s) 2026.
World J Cardiol. Mar 26, 2026; 18(3): 116115
Published online Mar 26, 2026. doi: 10.4330/wjc.v18.i3.116115
Published online Mar 26, 2026. doi: 10.4330/wjc.v18.i3.116115
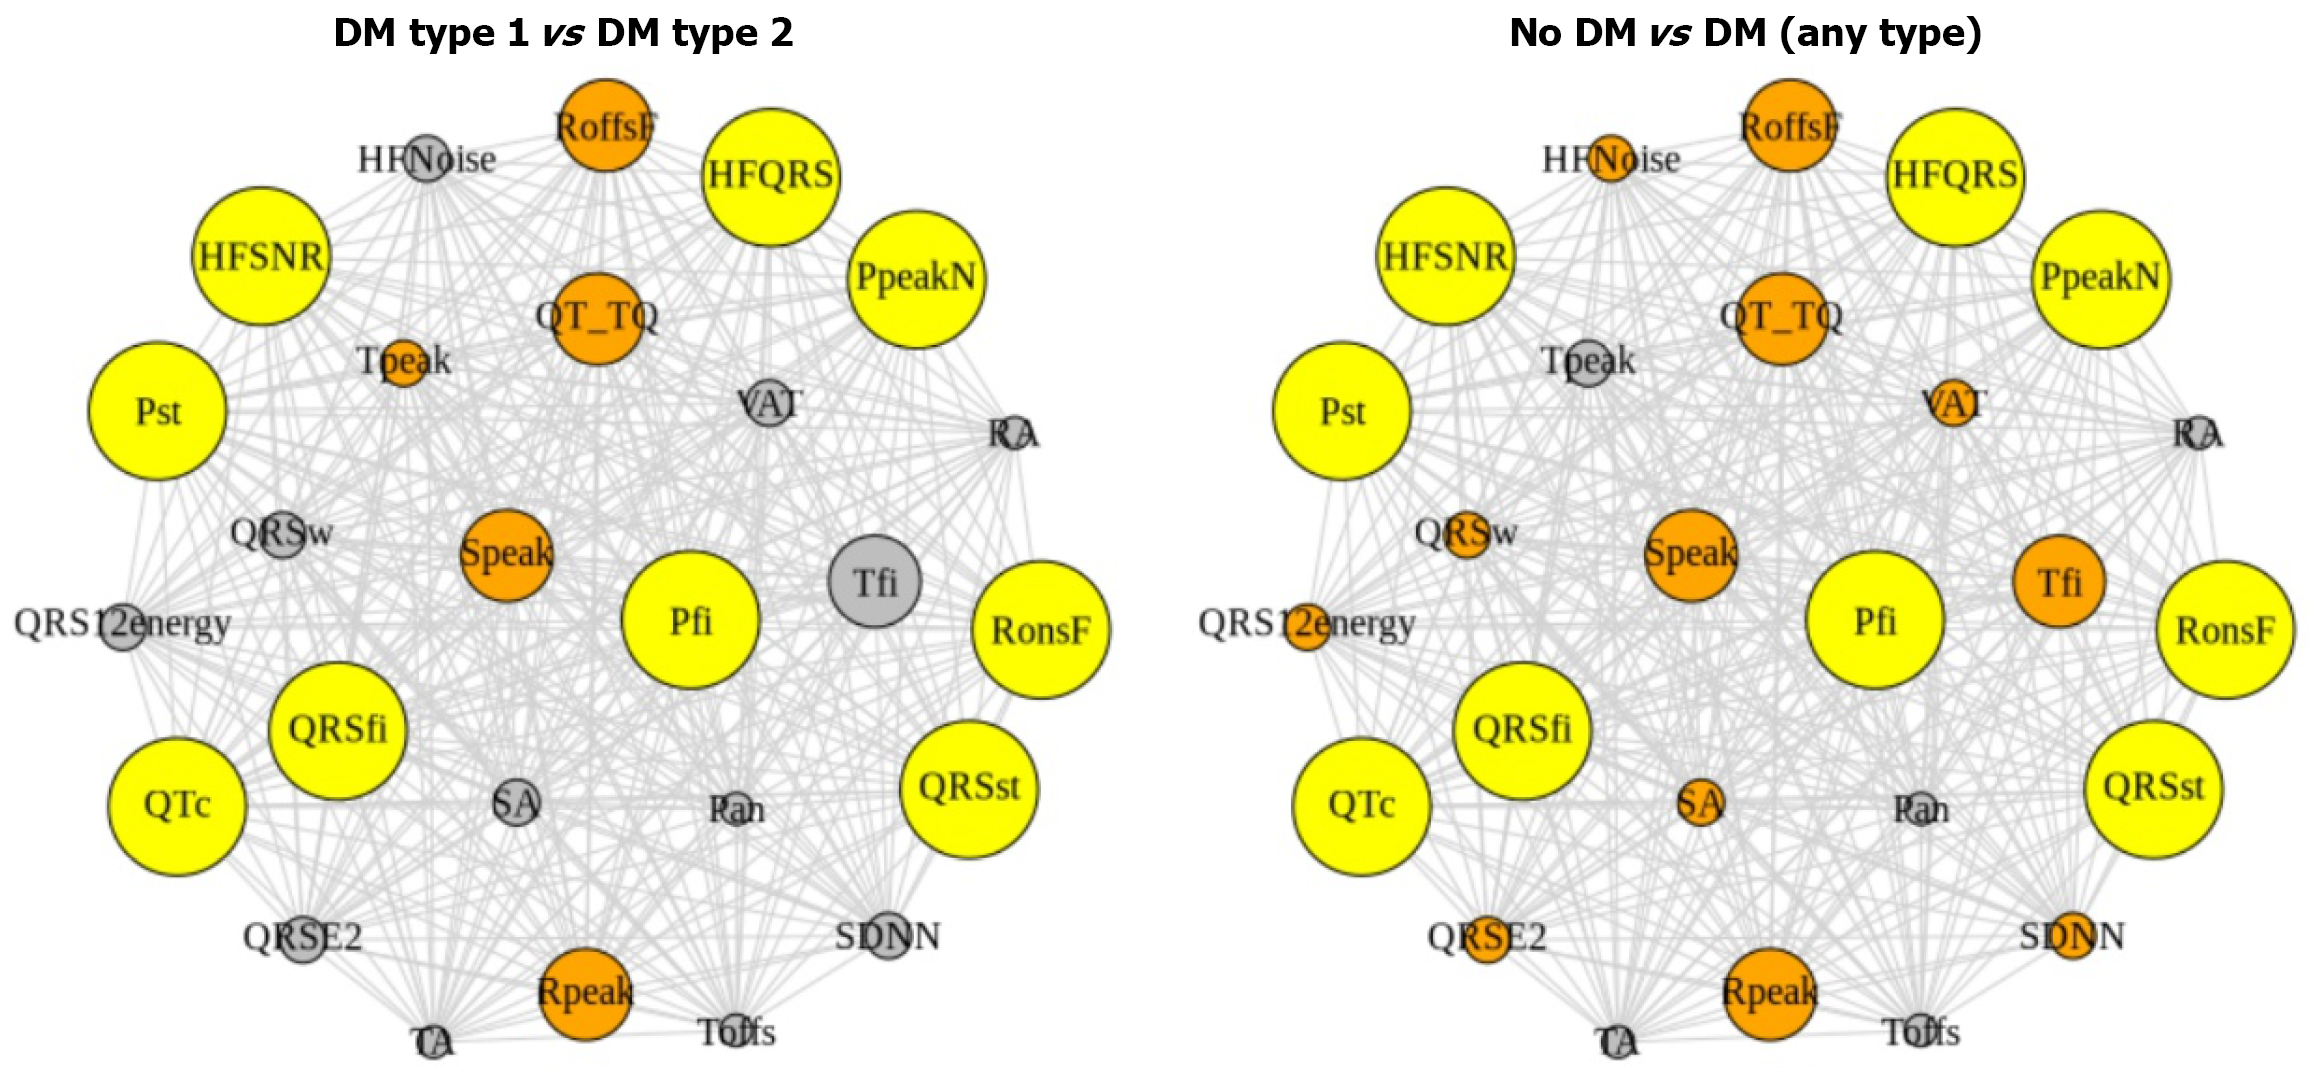
Figure 1 A network of factors demonstrating statistically significant differences in Holm-corrected pairwise comparisons are presented.
The largest nodes (depicted in yellow) represent factors that exhibited significant differences across all three groups. Medium-sized nodes correspond to factors differing between any two groups, while the smallest nodes indicate factors significant for only a single group. On the left graph, the nodes are coloured (yellow or orange) according to their ability to differentiate between the types of diabetes. The right graph shows nodes that distinguish the control group from either type of diabetes (significance observed in either "no DM" vs "T1DM", "no DM" vs "T2DM", or across all three classes). The factors that did not appear in both graphs did not demonstrate statistically significant pairwise comparisons after multiplicity correction. DM: Diabetes mellitus; Tfi: T-wave flattening; Pfi: P-wave dispersion index; QTc: Prolonged QT interval; VAT: Ventricular activation.
- Citation: Karbovskaya AD, Marzoog BA, Stroeva A, Chomakhidze P, Gognieva D, Kuznetsova N, Syrkin A, Fadeev VV, Poluboyarinova IV, Ismailova SM, Suvorov A, Kopylov P. Discriminating diabetes mellitus from single-lead electrocardiography using machine learning and multinomial regression. World J Cardiol 2026; 18(3): 116115
- URL: https://www.wjgnet.com/1949-8462/full/v18/i3/116115.htm
- DOI: https://dx.doi.org/10.4330/wjc.v18.i3.116115