
















Copyright: ©Author(s) 2026.
World J Cardiol. Mar 26, 2026; 18(3): 114077
Published online Mar 26, 2026. doi: 10.4330/wjc.v18.i3.114077
Published online Mar 26, 2026. doi: 10.4330/wjc.v18.i3.114077
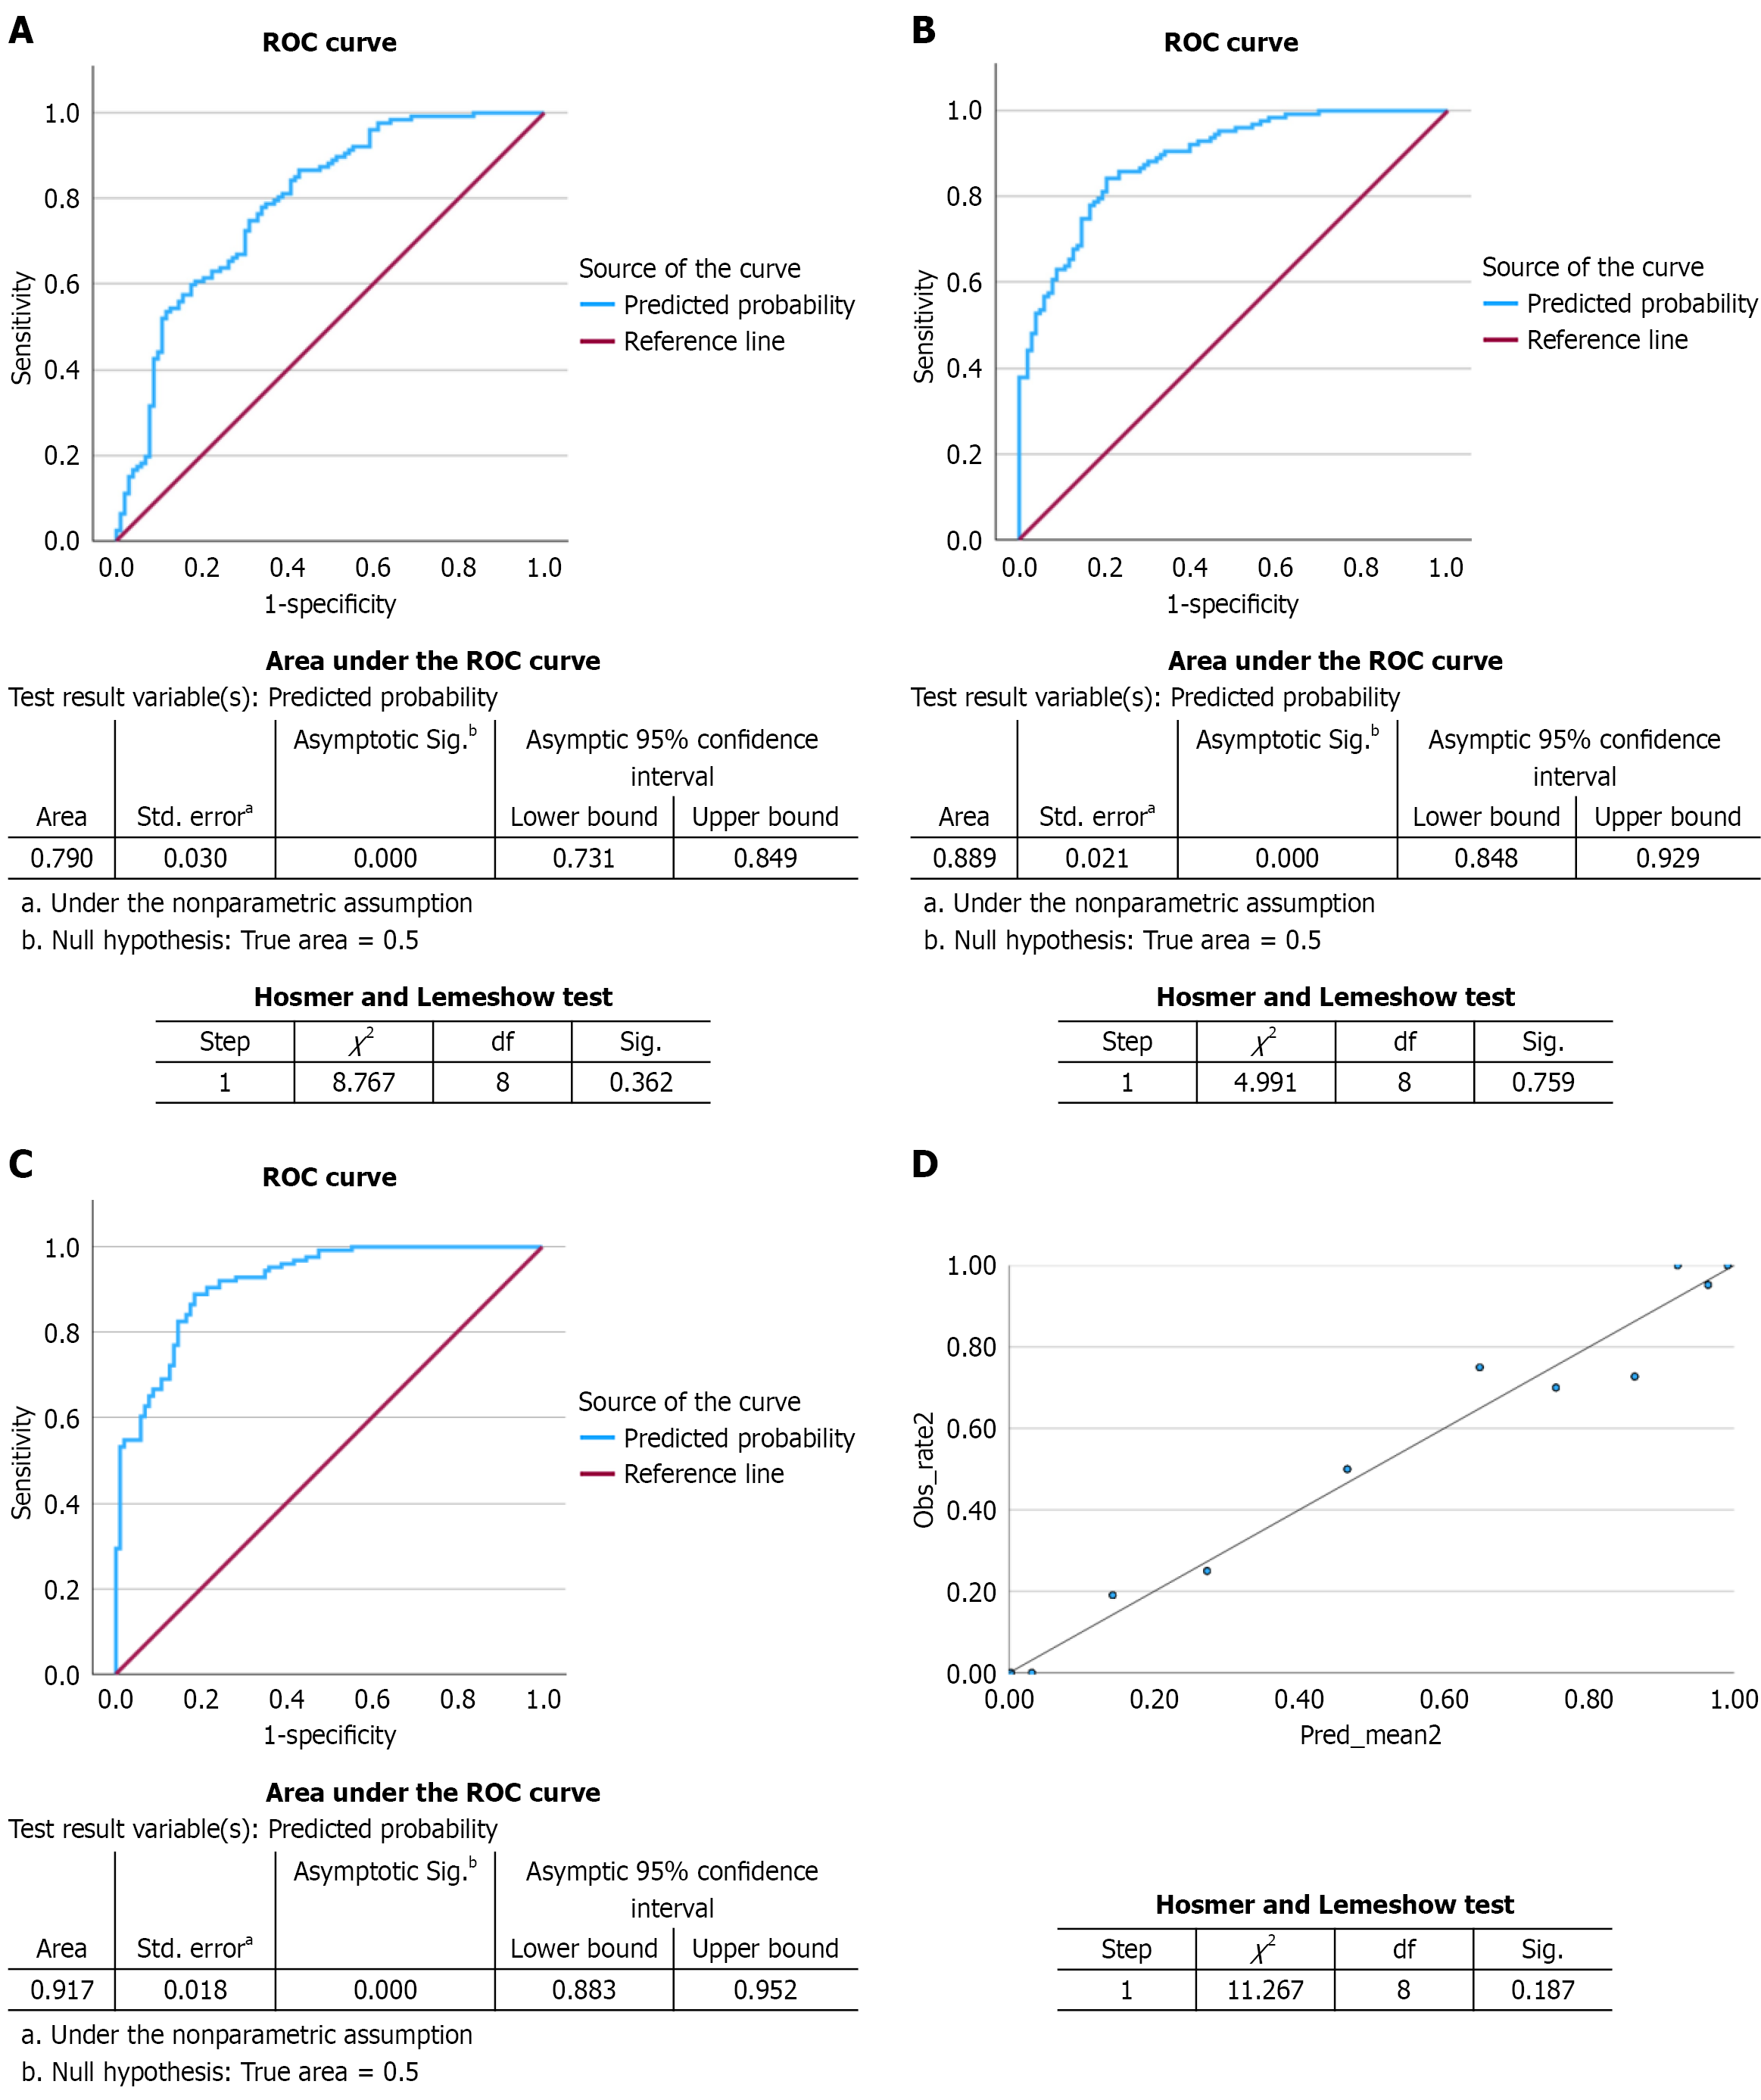
Figure 6 Receiver operating characteristic curves and calibration analysis of logistic regression models for predicting mitral annular calcification.
aThe standard error of the area under the curve (AUC) was calculated under the non-parametric assumption; bStatistical significance of the AUC was assessed using an asymptotic test against the null hypothesis of an area equal to 0.5. A: Receiver operating characteristic (ROC) curves for multivariable logistic regression models Ib; B: ROC curves for multivariable logistic regression model IIb. Model Ib demonstrated moderate discrimination [AUC 0.790; 95% confidence interval (CI): 0.731-0.849, P < 0.001; Hosmer-Lemeshow (HL) χ2 = 8.767, df = 8, P = 0.362]. Model IIb showed improved discrimination (AUC 0.889; 95%CI: 0.848-0.929; P < 0.001) and good calibration (HL χ2 = 4.991, df = 8, P = 0.759). The diagonal line indicates the reference line (AUC = 0.5); C: The ROC curve for the fully adjusted multivariable prediction model (model IIIb) shows excellent discriminative performance, with an AUC of 0.917 (95%CI: 0.883-0.952; P < 0.001); D: The calibration plot compares observed event rates with predicted probabilities across deciles of predicted risk, with the diagonal line indicating perfect calibration. Model calibration was adequate, as indicated by the HL goodness-of-fit test: χ2 = 11.267, df = 8, P = 0.187. ROC: Receiver operating characteristic.
- Citation: Vuckovic M, Grgurić J, Paic F, Radonic V, Jurin I, Filipec Kanizaj T, Letilovic T. Valvular calcification in liver cirrhosis: A comparison with non-cirrhotic cardiovascular controls. World J Cardiol 2026; 18(3): 114077
- URL: https://www.wjgnet.com/1949-8462/full/v18/i3/114077.htm
- DOI: https://dx.doi.org/10.4330/wjc.v18.i3.114077