
















Copyright: ©Author(s) 2026.
World J Cardiol. Mar 26, 2026; 18(3): 114077
Published online Mar 26, 2026. doi: 10.4330/wjc.v18.i3.114077
Published online Mar 26, 2026. doi: 10.4330/wjc.v18.i3.114077
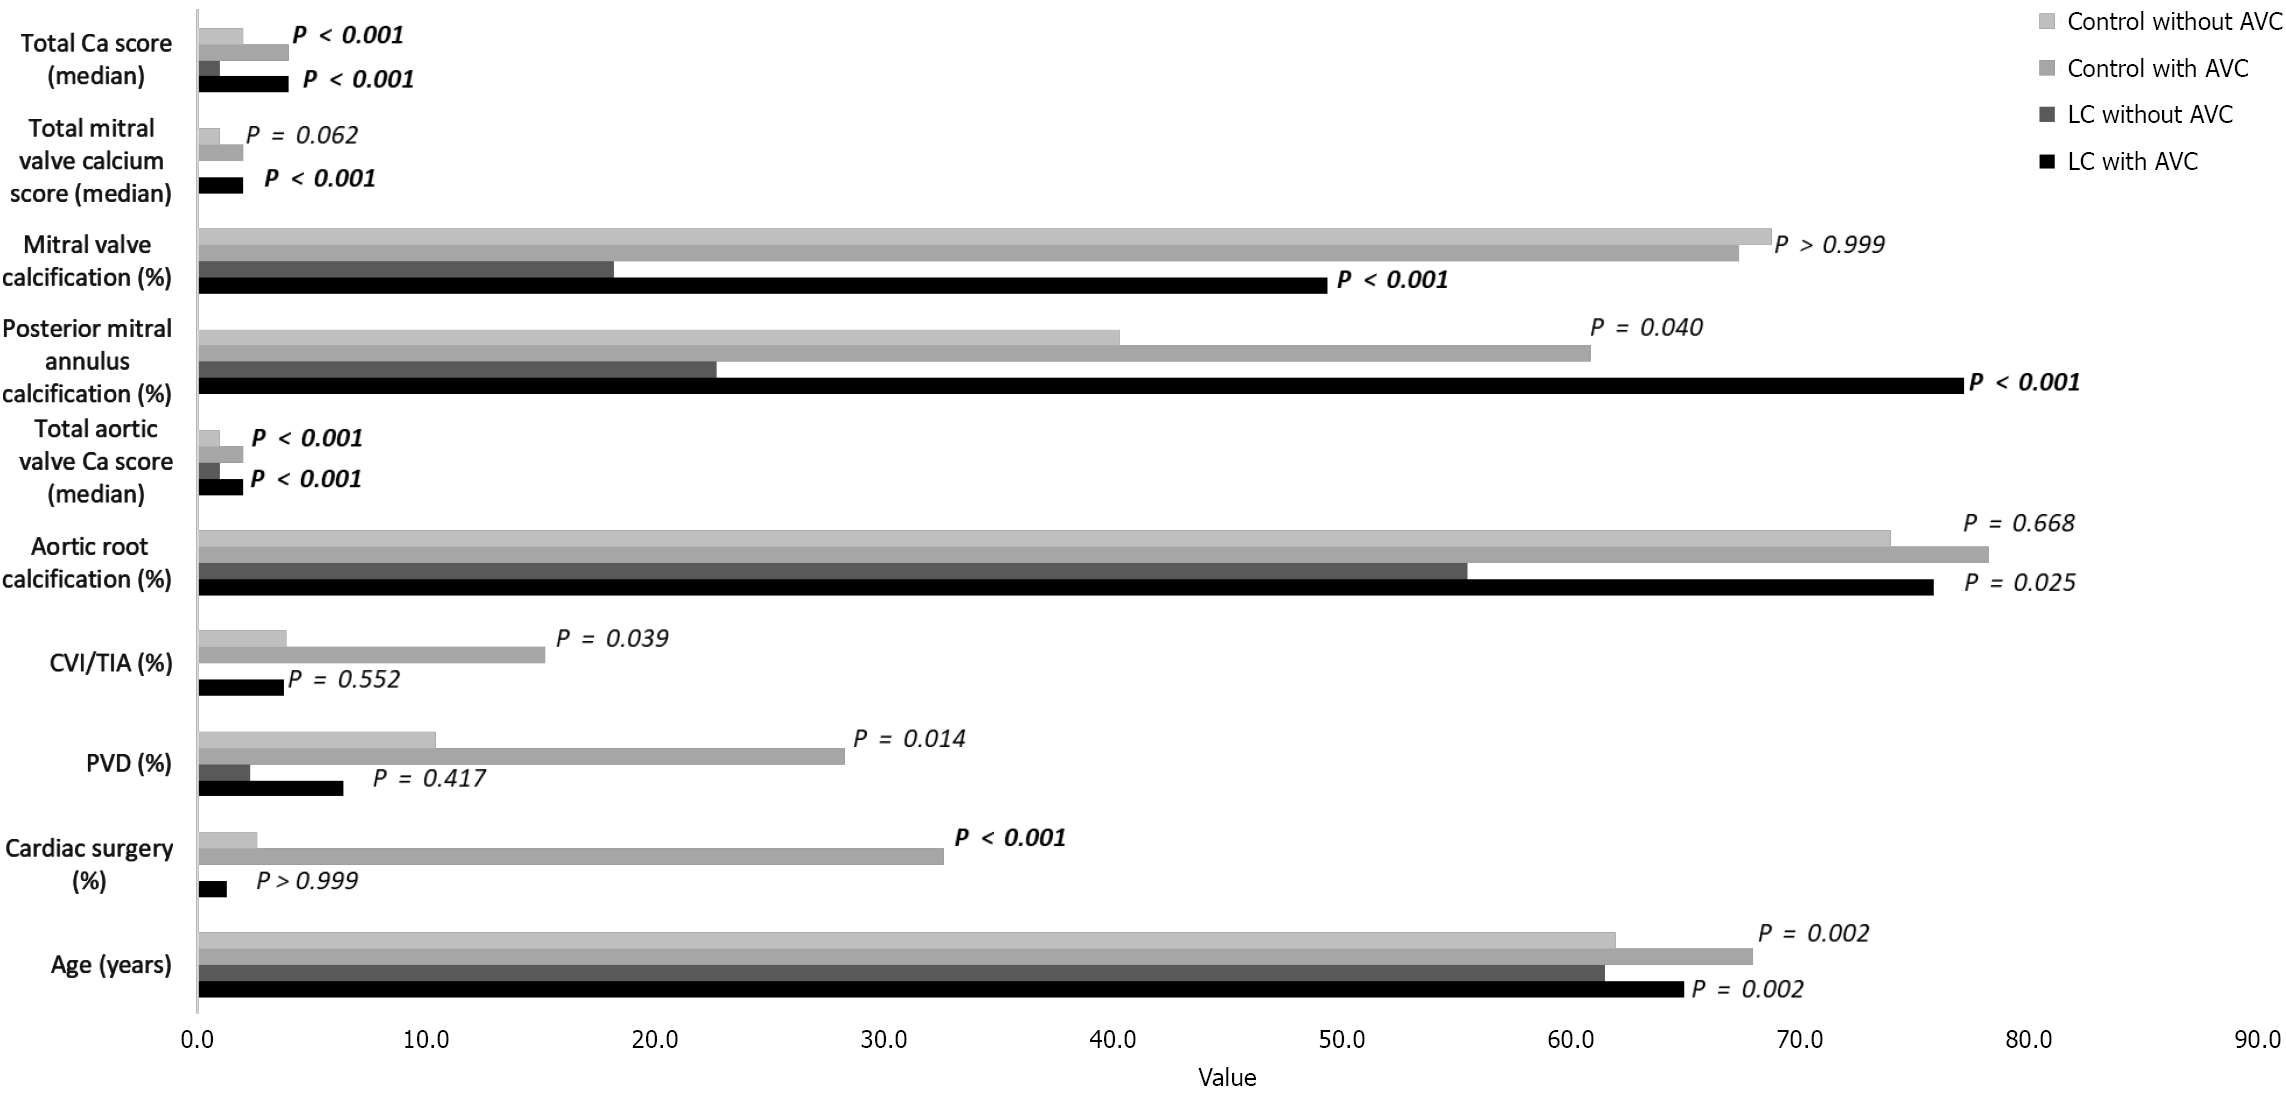
Figure 3 Demographic, clinical, and calcification characteristics in patients with and without aortic valve calcification, stratified by liver cirrhosis status.
Horizontal bar chart comparing key variables across four groups: Controls without aortic valve calcification (AVC), controls with AVC, patients with liver cirrhosis (LC) without AVC, and those with LC with AVC. Displayed parameters include age (years), prior cardiac surgery (%), peripheral vascular disease (%), cerebrovascular insult/transient ischemic attack (%), aortic root calcification (%), total aortic calcium score, posterior mitral annular calcium score, mitral valve calcification (%), total mitral calcium score, and total calcium score. The chart highlights substantial differences in both valvular and vascular calcification burden between groups, with patients exhibiting AVC - especially those with LC - showing markedly elevated calcium scores and higher prevalence of associated vascular comorbidities. P values are displayed to the right of each horizontal bar, adjacent to the corresponding group comparisons for every variable. Bold P values indicate statistical significance after Bonferroni correction. Ca: Calcium; PVD: Peripheral vascular disease; CVI: Cerebrovascular insult; TIA: Transient ischemic attack; AVC: Aortic valve calcification; LC: Liver cirrhosis.
- Citation: Vuckovic M, Grgurić J, Paic F, Radonic V, Jurin I, Filipec Kanizaj T, Letilovic T. Valvular calcification in liver cirrhosis: A comparison with non-cirrhotic cardiovascular controls. World J Cardiol 2026; 18(3): 114077
- URL: https://www.wjgnet.com/1949-8462/full/v18/i3/114077.htm
- DOI: https://dx.doi.org/10.4330/wjc.v18.i3.114077