
















©The Author(s) 2026.
World J Cardiol. Feb 26, 2026; 18(2): 111861
Published online Feb 26, 2026. doi: 10.4330/wjc.v18.i2.111861
Published online Feb 26, 2026. doi: 10.4330/wjc.v18.i2.111861
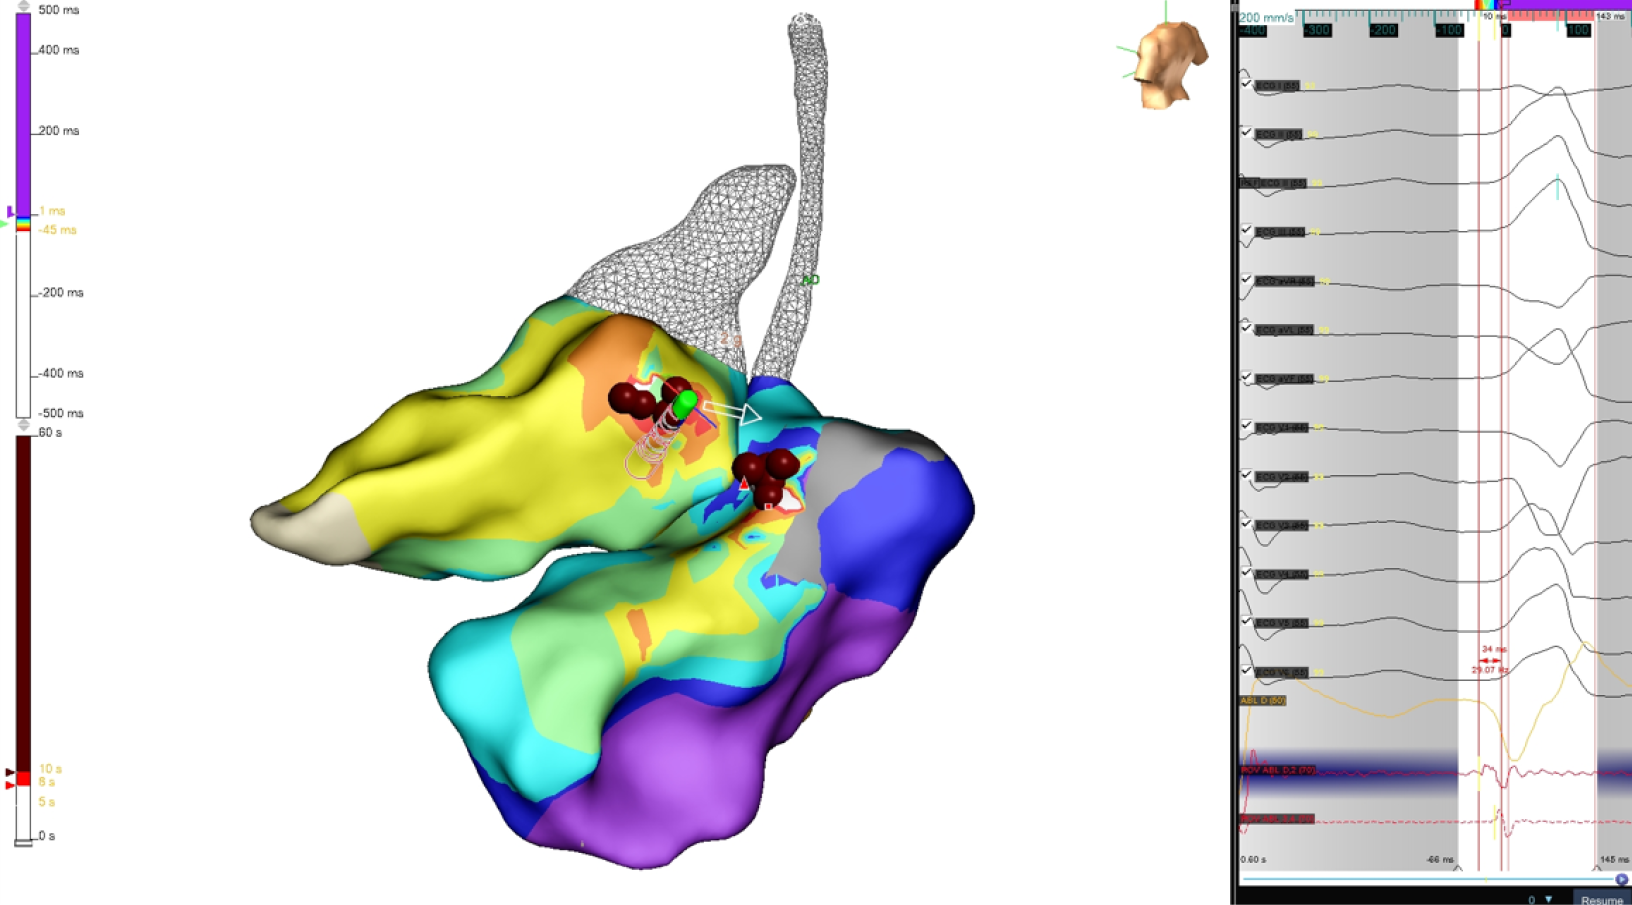
Figure 3 Left ventricular/right ventricular activation map and electrocardiogram/electrogram signals.
Best signals recorded (-34 milliseconds) in mitroaortic continuity, 5 lesions (max 35 W, 60 seconds, medium impedance drop 10.2 ohms) were performed without disappearance of arrhythmias. An anatomical approach was performed with the other 4 lesions in the posteroseptal right ventricular outflow tract. The arrow indicates catheter direction during mapping (Supplementary material).
- Citation: Palamà Z, Tricarico G, Scarà A, Robles AG, De Masi De Luca G, Nesti M, Romano S, Sciarra L. Late left ventricular summit premature ventricular contractions elimination with new TactiFlex irrigation technology. World J Cardiol 2026; 18(2): 111861
- URL: https://www.wjgnet.com/1949-8462/full/v18/i2/111861.htm
- DOI: https://dx.doi.org/10.4330/wjc.v18.i2.111861