
















Copyright: ©Author(s) 2026.
World J Cardiol. Oct 26, 2026; 18(10): 125761
Published online Oct 26, 2026. doi: 10.4330/wjc.125761
Published online Oct 26, 2026. doi: 10.4330/wjc.125761
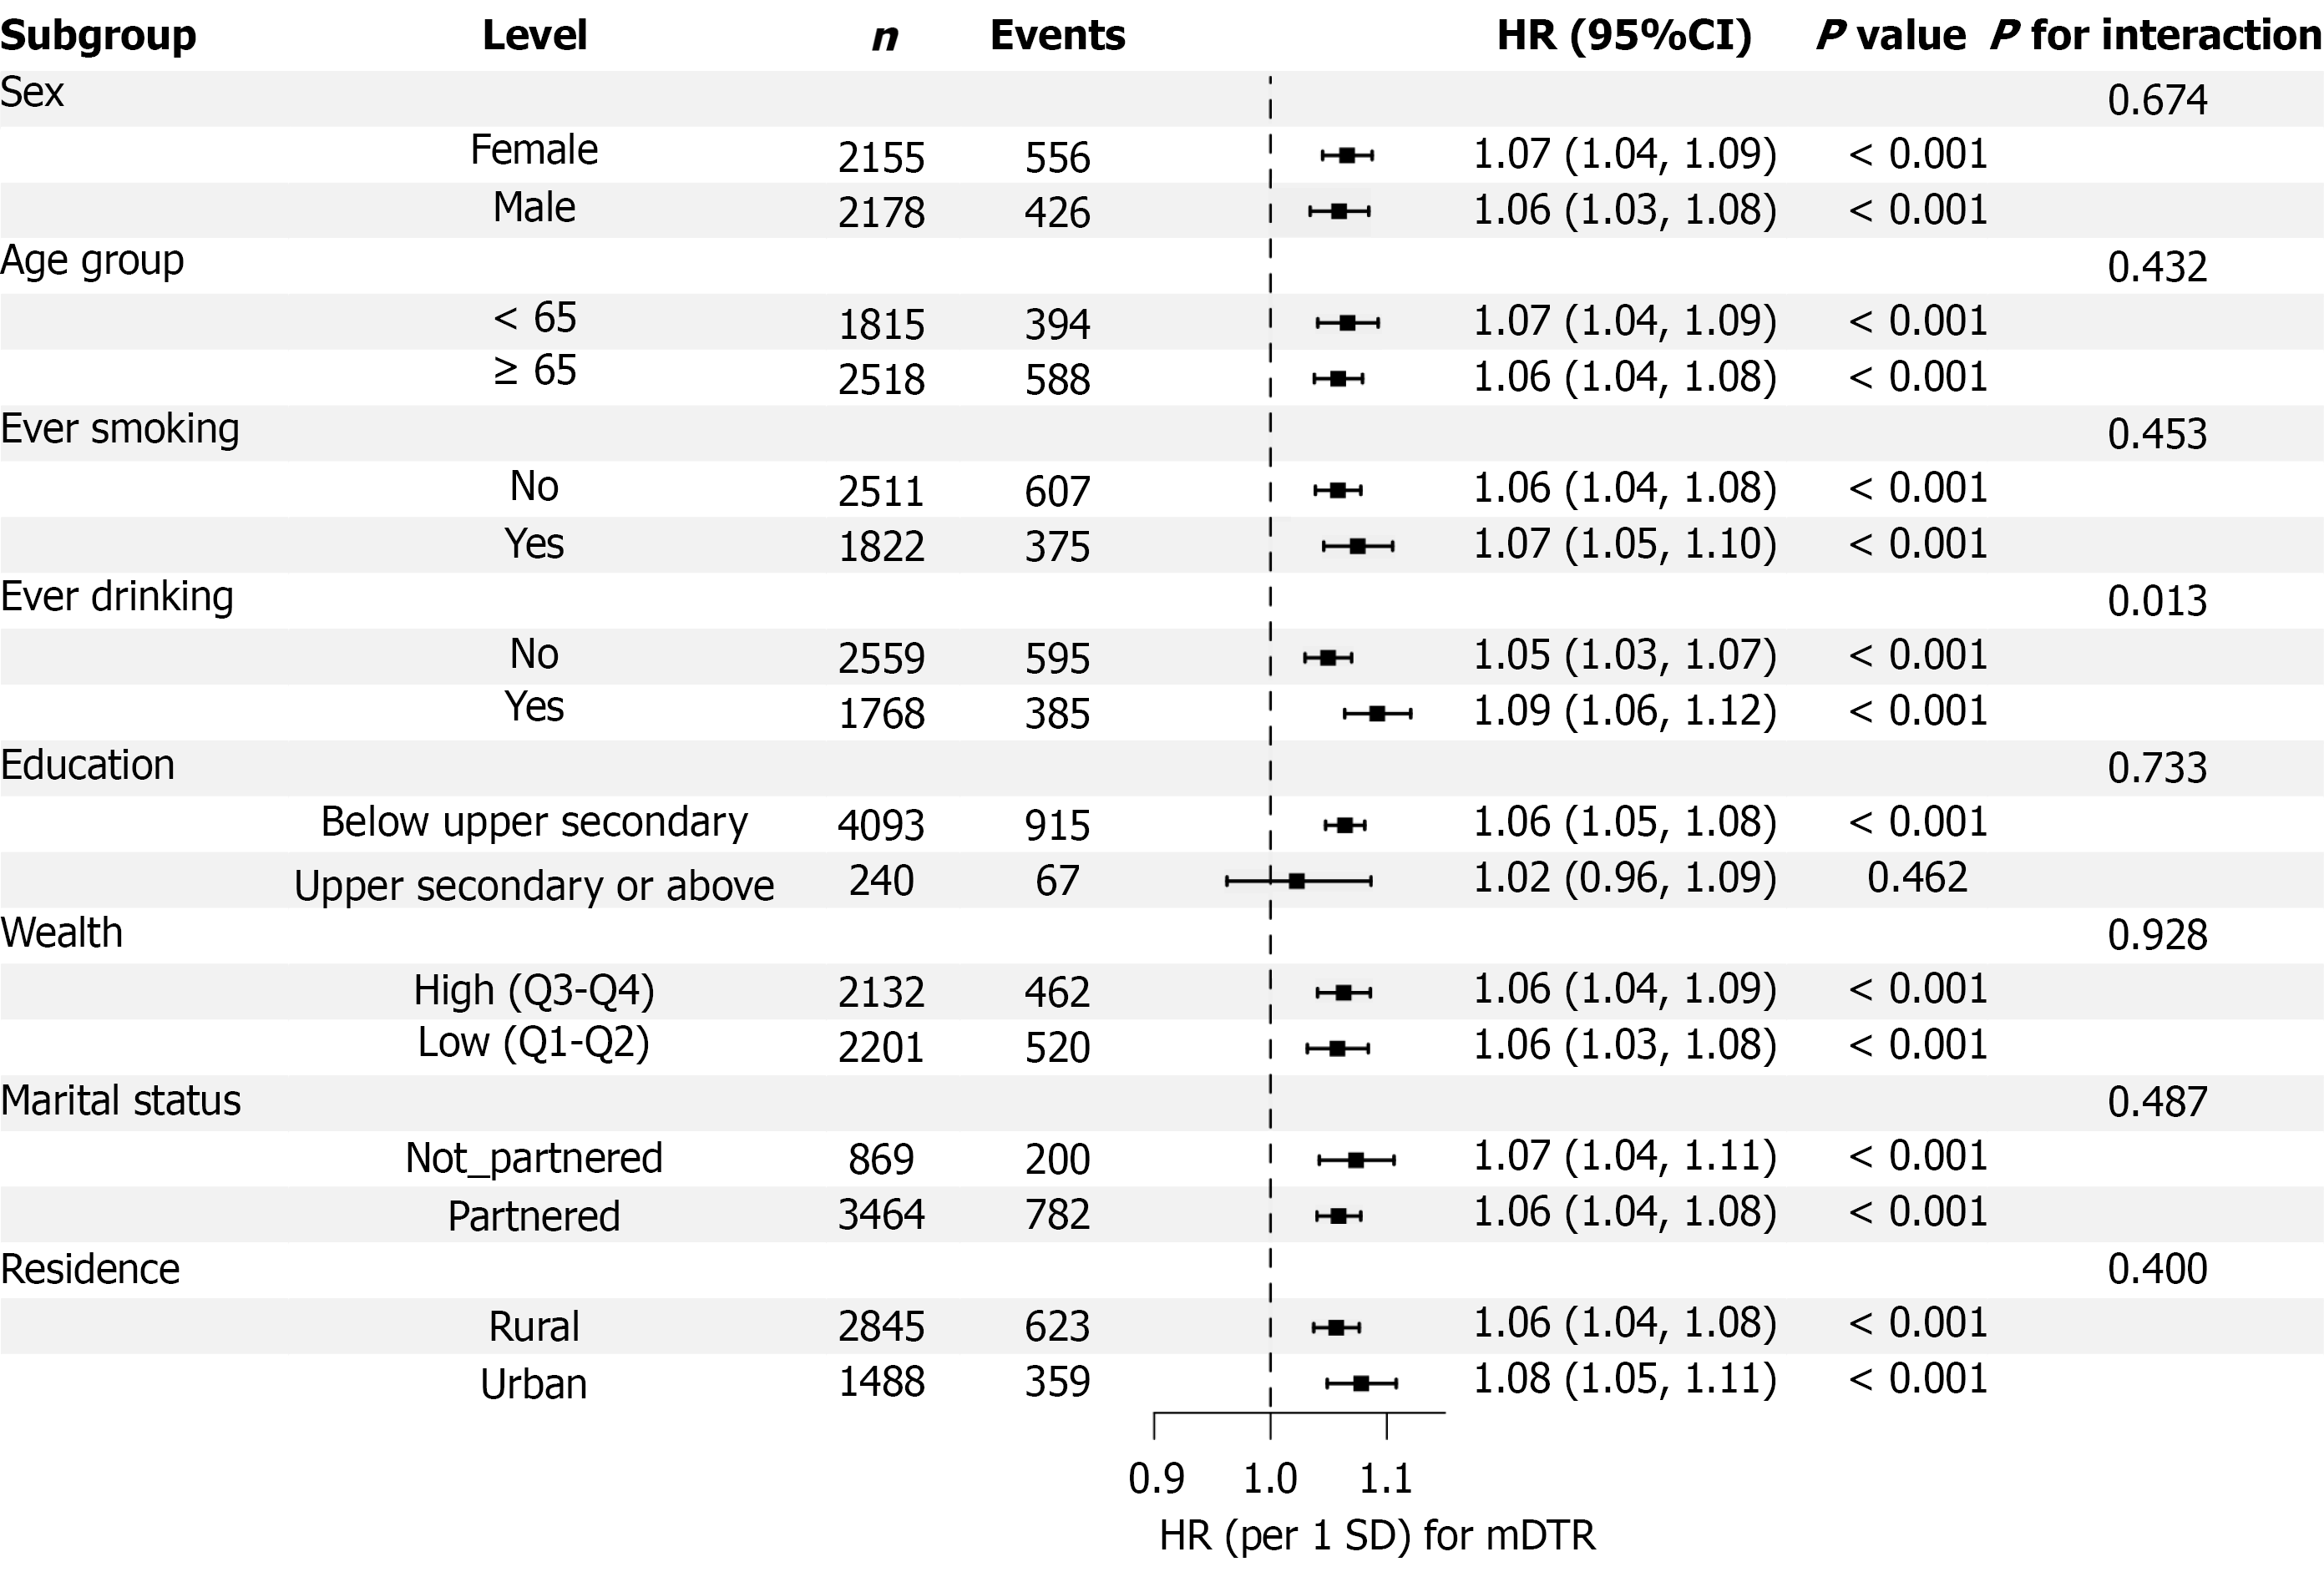
Figure 4 Forest plot of subgroup analyses for the association between mean diurnal temperature range and incident cardiovascular disease risk.
Hazard ratios and 95% confidence intervals are shown for each subgroup. P values for interaction are indicated on the right. Models were adjusted for age, sex, education, wealth, residence, marital status, smoking, drinking, body mass index, and fine particulate matter with an aerodynamic diameter ≤ 2.5 μm. CI: Confidence interval; CVD: Cardiovascular disease; mDTR: Mean diurnal temperature range; HR: Hazard ratio.
- Citation: Yang TY, Zhang YH, Sun QY, Wang YR, Wang KJ. Diurnal temperature range, daily mean temperature, and incident cardiovascular disease in older adults: A longitudinal cohort study. World J Cardiol 2026; 18(10): 125761
- URL: https://www.wjgnet.com/1949-8462/full/v18/i10/125761.htm
- DOI: https://dx.doi.org/10.4330/wjc.125761