
















©The Author(s) 2026.
World J Cardiol. Jan 26, 2026; 18(1): 112636
Published online Jan 26, 2026. doi: 10.4330/wjc.v18.i1.112636
Published online Jan 26, 2026. doi: 10.4330/wjc.v18.i1.112636
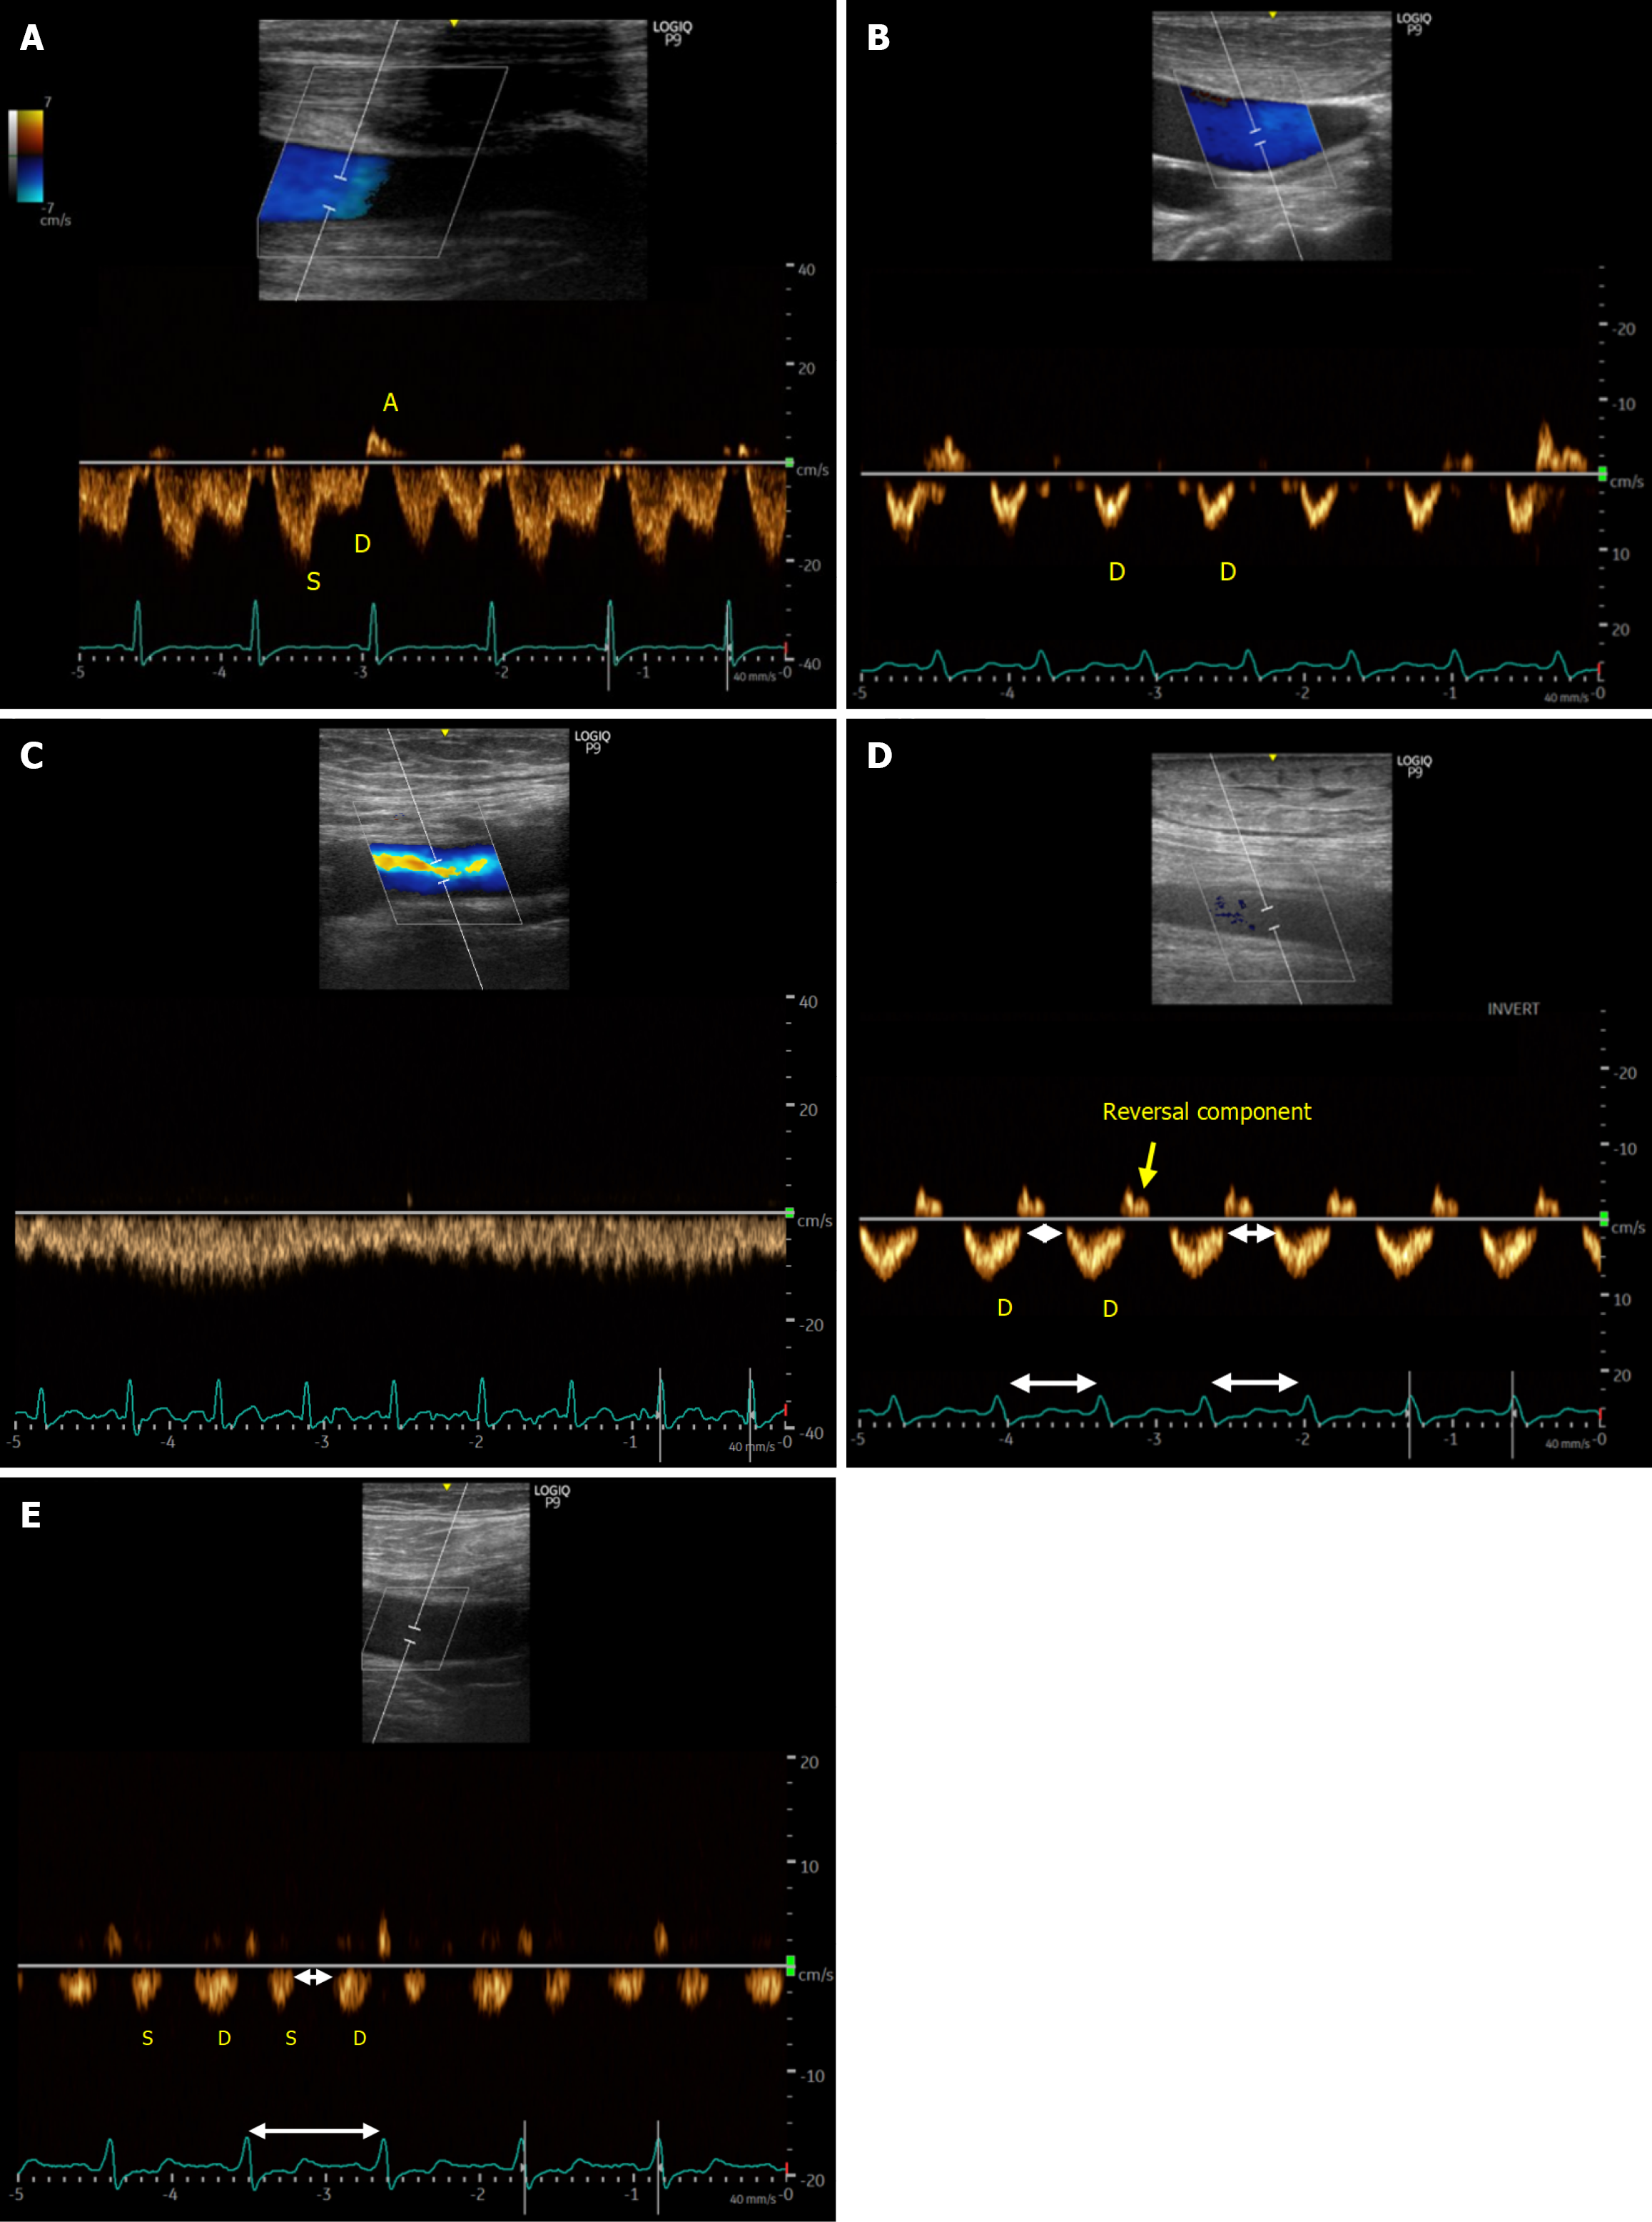
Figure 3 Internal jugular and femoral vein Doppler patterns across congestion states.
A and B: Doppler waveforms of the internal jugular vein showing a normal pattern (A) and a severely abnormal pattern (B). In the normal waveform, the systolic wave is greater than the diastolic (D) wave. In the abnormal pattern, the systolic wave disappears, leaving only a prominent D-wave below the baseline, indicating flow toward the heart in diastole; C and D: Normal femoral vein Doppler waveform (C) compared with a waveform showing elevated stasis index (D), characterized by prolonged flow gaps during the cardiac cycle, indicated by white double-headed arrows. The femoral vein stasis index is calculated as the percentage of this no-flow interval relative to the duration of the cardiac cycle. In this example, only a diastolic wave is seen below the baseline, with absent systolic flow; E: Another example of an elevated femoral vein stasis index, but with both systolic and D-waves below the baseline. Presumably a less severe pattern than D.
- Citation: Koratala A. Extended venous excess ultrasound: A promising addition to point-of-care ultrasound-based venous congestion assessment. World J Cardiol 2026; 18(1): 112636
- URL: https://www.wjgnet.com/1949-8462/full/v18/i1/112636.htm
- DOI: https://dx.doi.org/10.4330/wjc.v18.i1.112636