
















©The Author(s) 2025.
World J Cardiol. Sep 26, 2025; 17(9): 110403
Published online Sep 26, 2025. doi: 10.4330/wjc.v17.i9.110403
Published online Sep 26, 2025. doi: 10.4330/wjc.v17.i9.110403
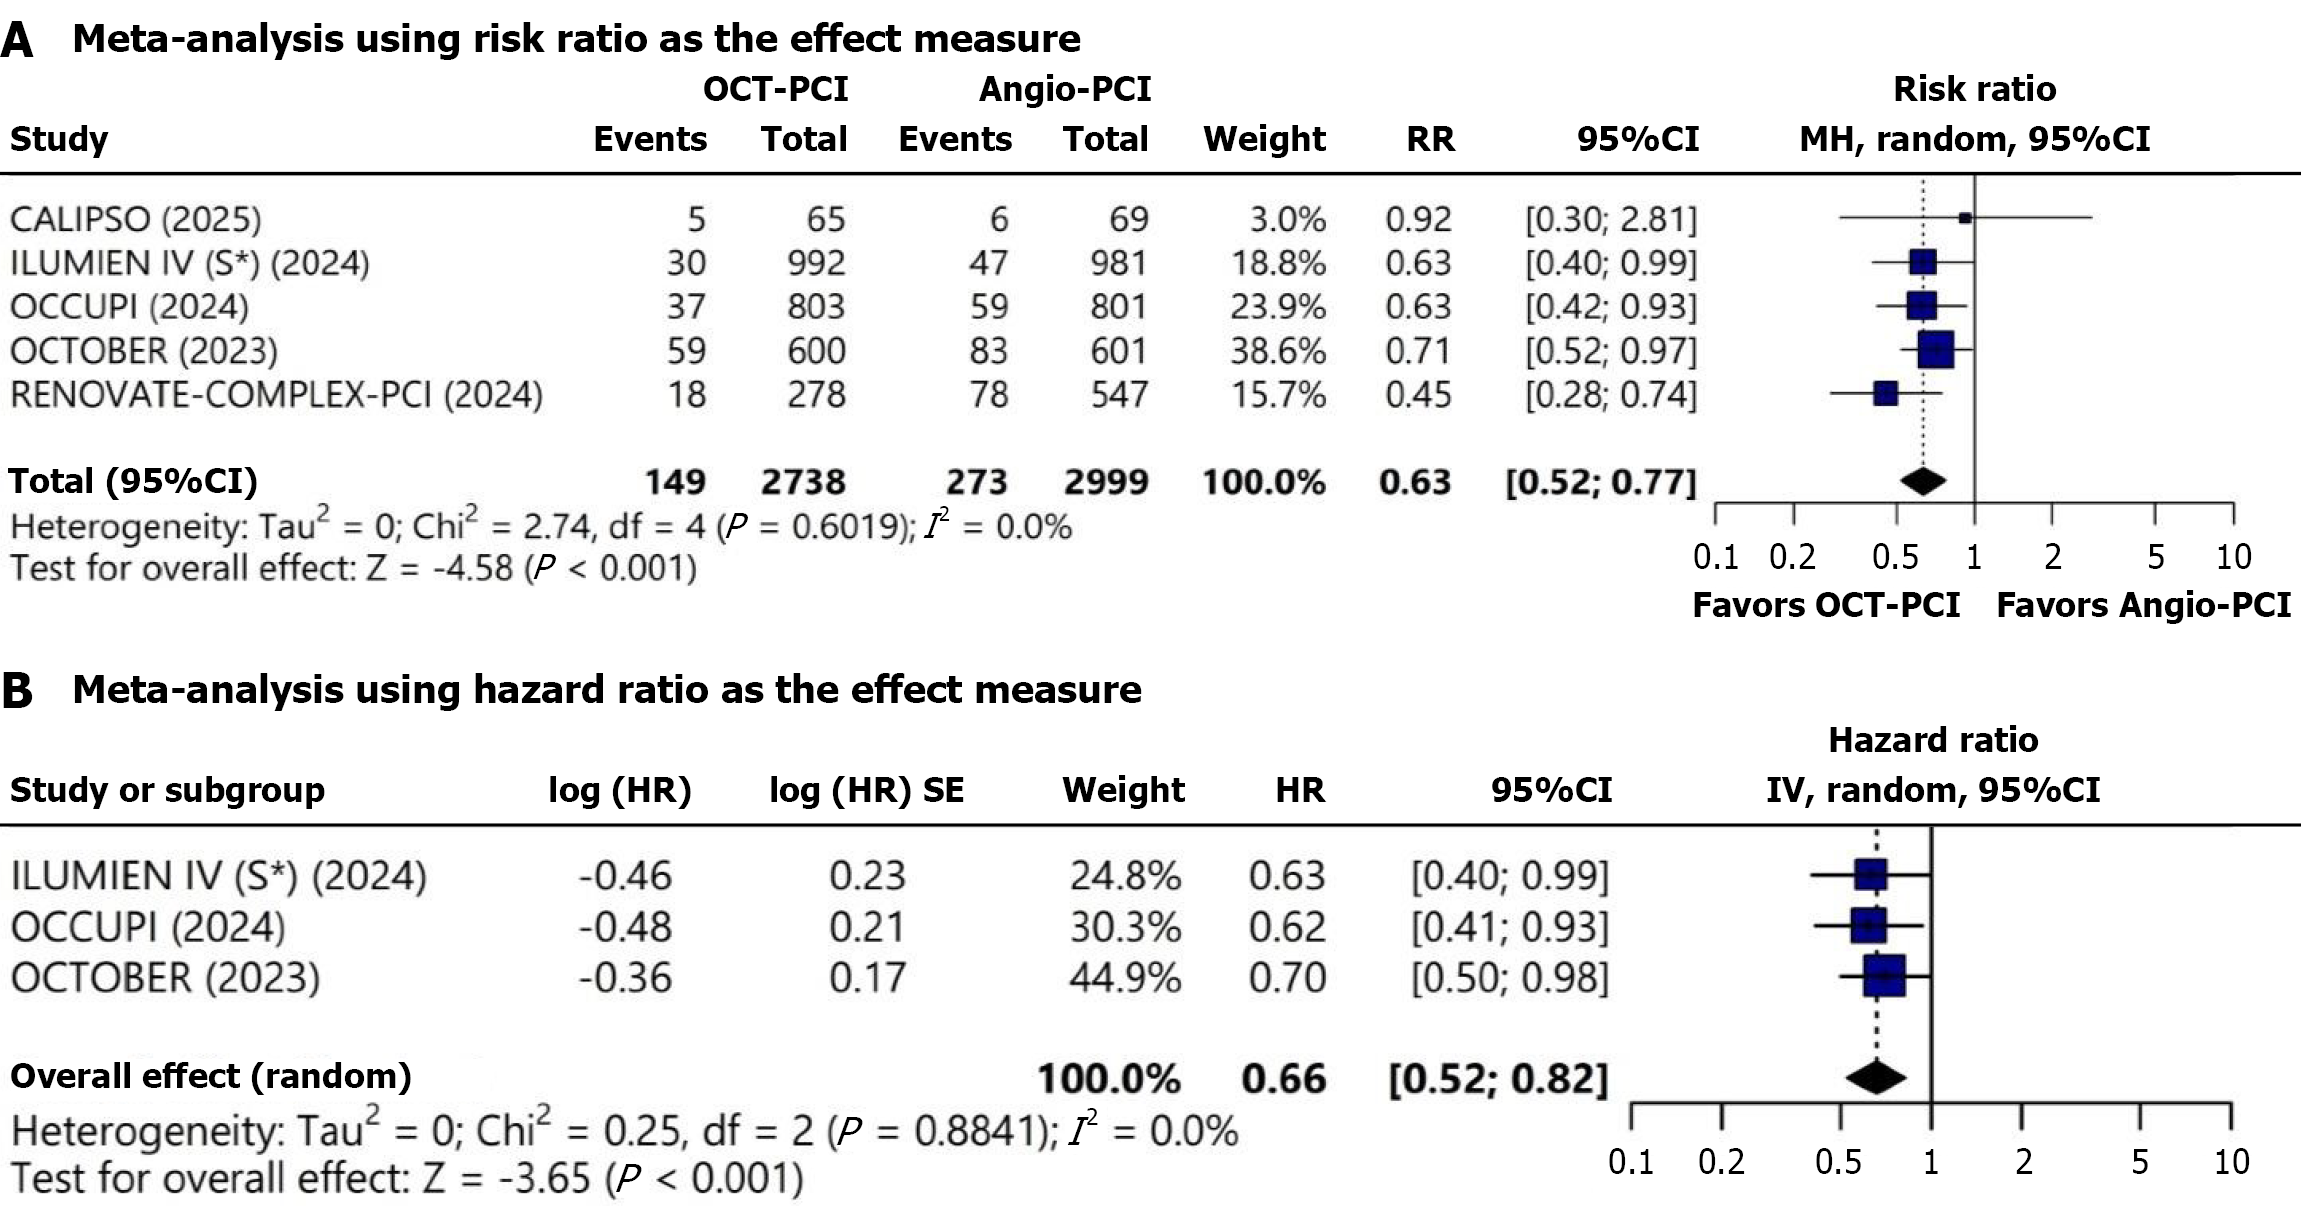
Figure 2 Forest plots of studies comparing optical coherence tomography-guided percutaneous coronary intervention with angiography-guided percutaneous coronary intervention in terms of major adverse clinical events.
A: Meta-analysis using risk ratio as the effect measure; B: Meta-analysis using hazard ratio as the effect measure. HR: Hazard ratio; OCT: Optical coherence tomography; PCI: Percutaneous coronary intervention; RR: Risk ratio.
- Citation: Burhan M, Saeed H, Usama M, Tariq A, Shafiq S, Hurjkaliani S, Iqbal M, Shahid S, Khalid S, Tahirkheli NK. Optical coherence tomography-guided percutaneous coronary intervention compared to angiography-guided percutaneous coronary intervention for complex lesions. World J Cardiol 2025; 17(9): 110403
- URL: https://www.wjgnet.com/1949-8462/full/v17/i9/110403.htm
- DOI: https://dx.doi.org/10.4330/wjc.v17.i9.110403