Copyright
©The Author(s) 2025.
World J Cardiol. Jul 26, 2025; 17(7): 108745
Published online Jul 26, 2025. doi: 10.4330/wjc.v17.i7.108745
Published online Jul 26, 2025. doi: 10.4330/wjc.v17.i7.108745
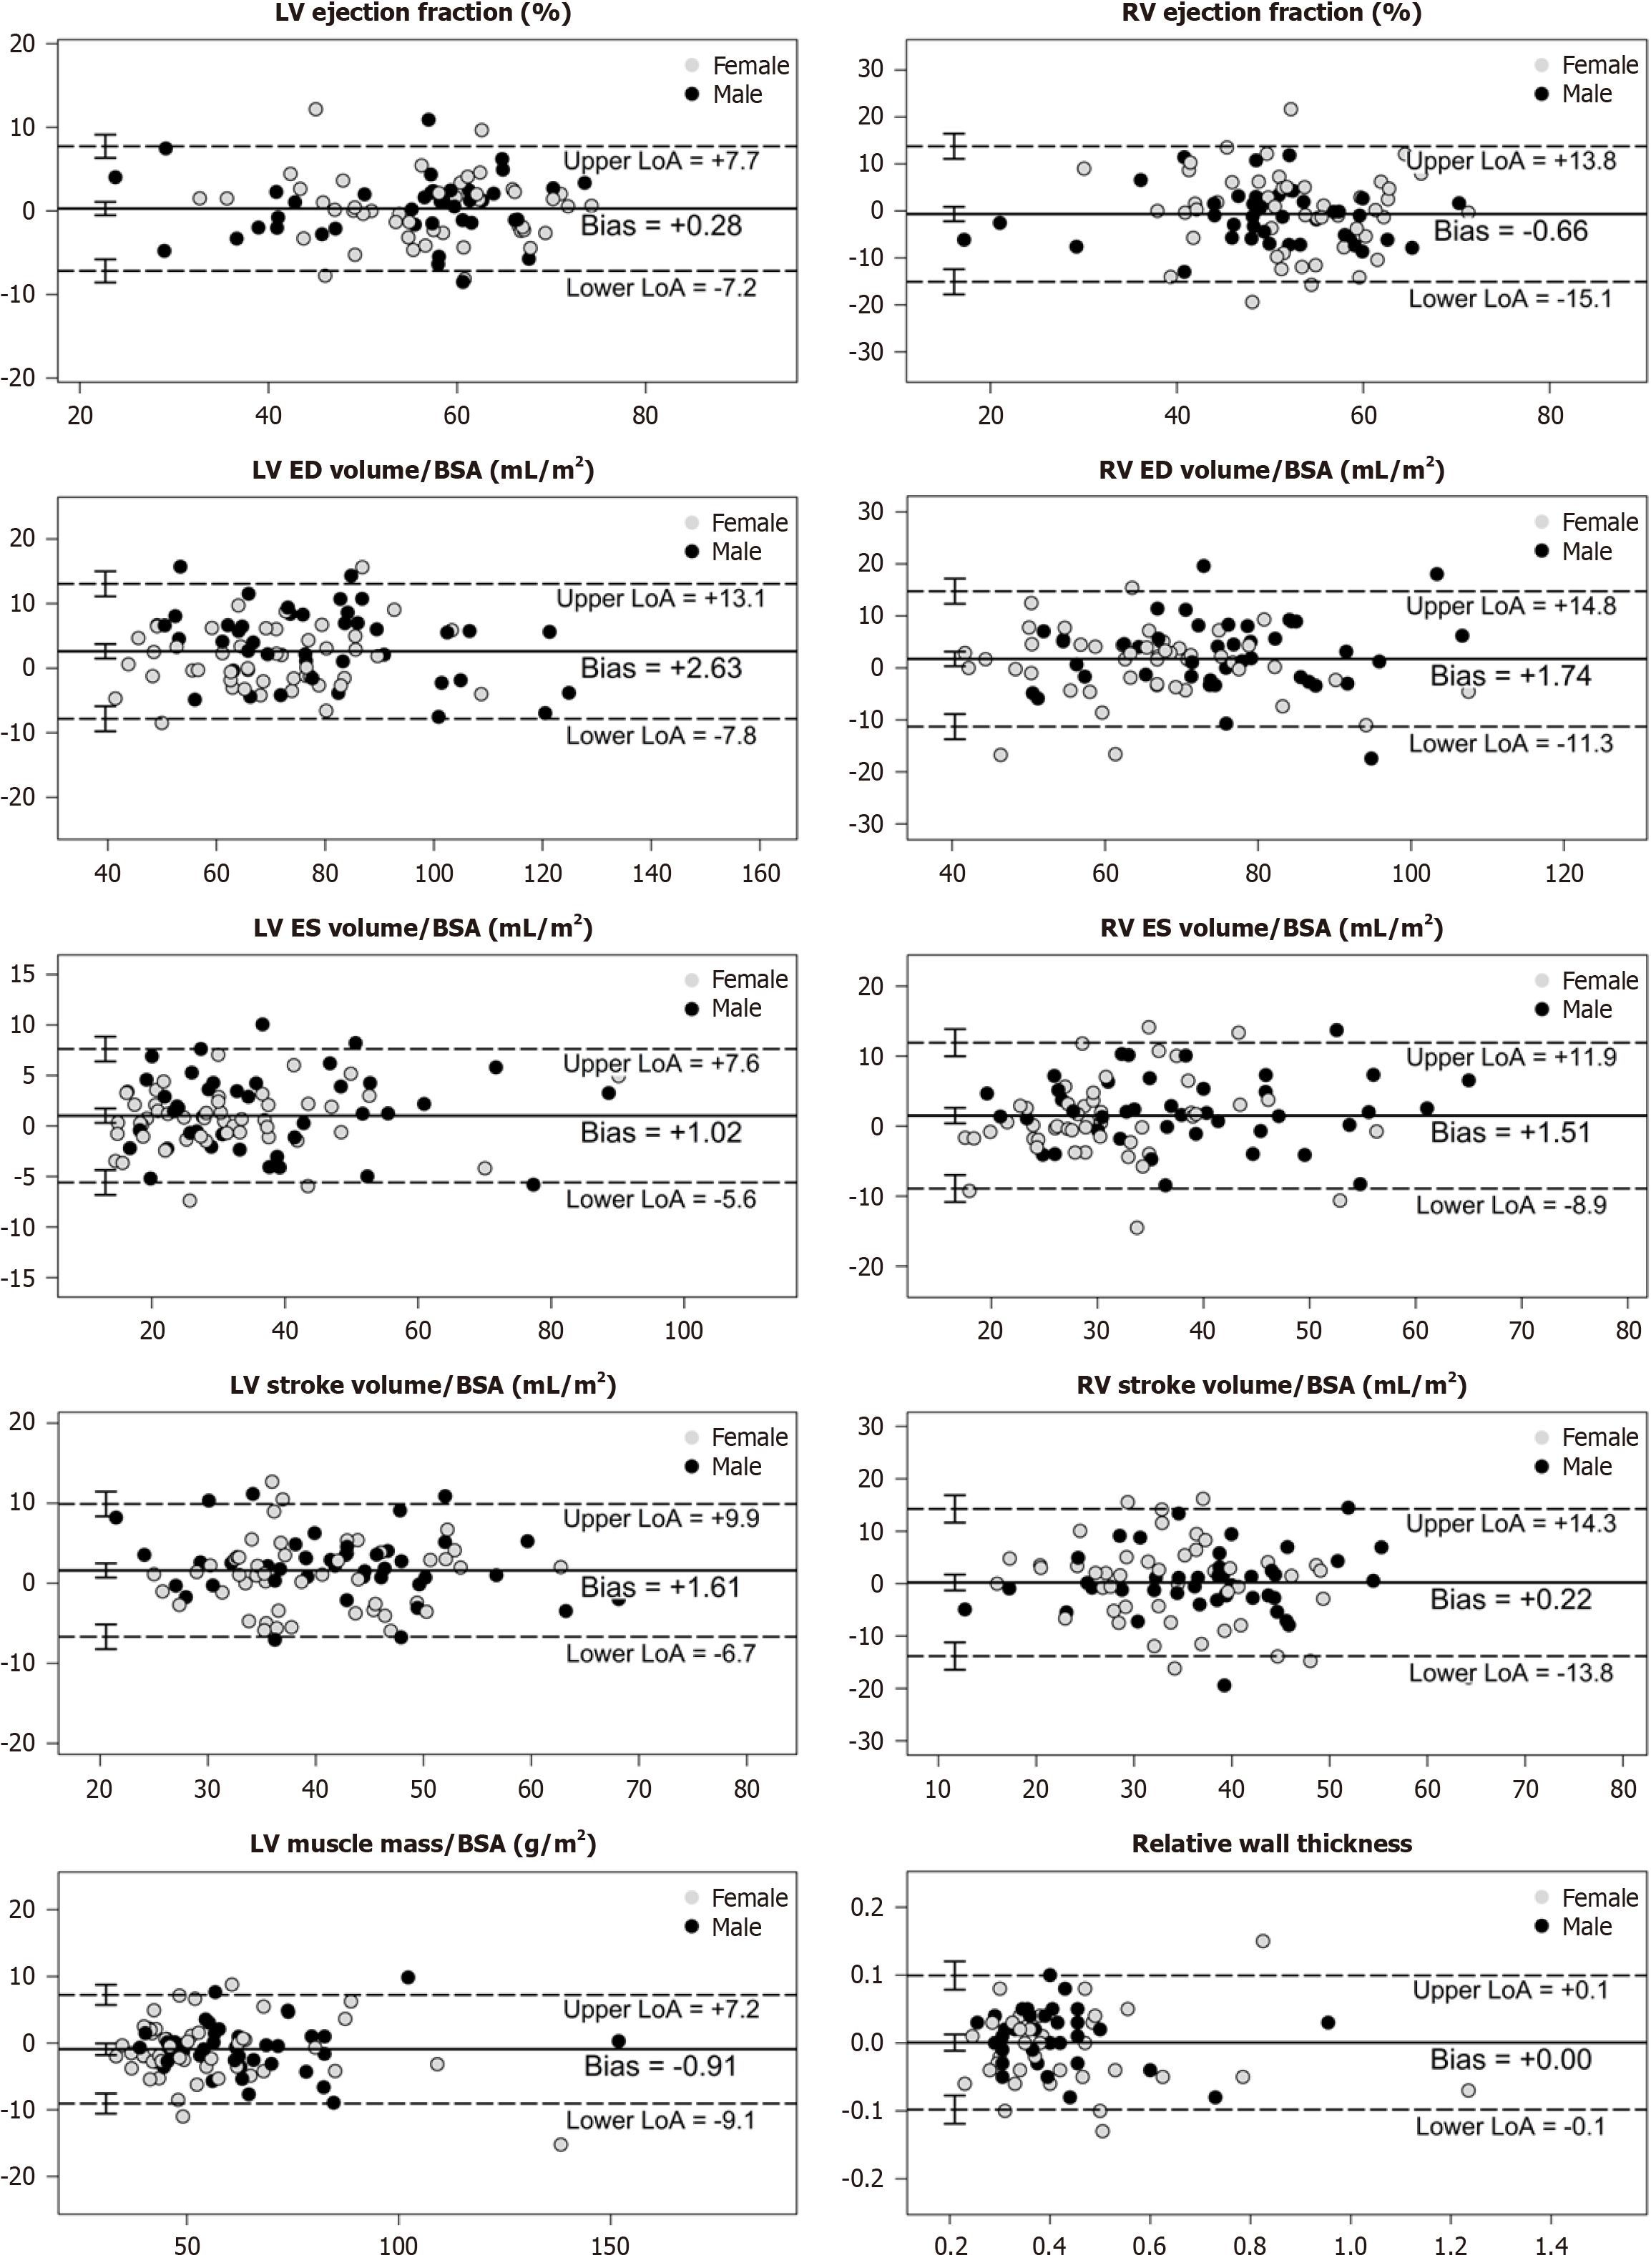
Figure 4 Bland–Altman plots reveal a strong agreement of metrics between conventional CINE and artificial-intelligence-assisted compressed sensing CINE.
The solid line represents the mean difference (bias), while dashed lines denote the upper and lower limits of agreement (LoA1.96SDdiff). Error bars, depicting confidence intervals, are presented for both the average difference and the limits of agreement. Visual inspection of the Bland–Altman plots revealed no obvious relationship between the differences and the magnitude of measurements, nor systematic bias. For each variable, conventional CINE (C-CINE) and artificial-intelligence-assisted compressed sensing CINE (AI-CS-CINE) revealed an acceptable mean difference. Nearly all measurement pairs lie within the limits of agreement, indicating the AI-CS-CINE method is highly comparable to C-CINE. The X-axis represents the mean of C-CINE and AI-CS-CINE values, while the Y-axis shows the difference between C-CINE and AI-CS-CINE. Dashed lines indicate the mean difference and 95% limits of agreement. BSA: Body surface area; LV: Left ventricle; RV: Right ventricle.
- Citation: Wang H, Schmieder A, Watkins M, Wang P, Mitchell J, Qamer SZ, Lanza G. Artificial intelligence-assisted compressed sensing CINE enhances the workflow of cardiac magnetic resonance in challenging patients. World J Cardiol 2025; 17(7): 108745
- URL: https://www.wjgnet.com/1949-8462/full/v17/i7/108745.htm
- DOI: https://dx.doi.org/10.4330/wjc.v17.i7.108745


