
















©The Author(s) 2025.
World J Cardiol. Dec 26, 2025; 17(12): 112389
Published online Dec 26, 2025. doi: 10.4330/wjc.v17.i12.112389
Published online Dec 26, 2025. doi: 10.4330/wjc.v17.i12.112389
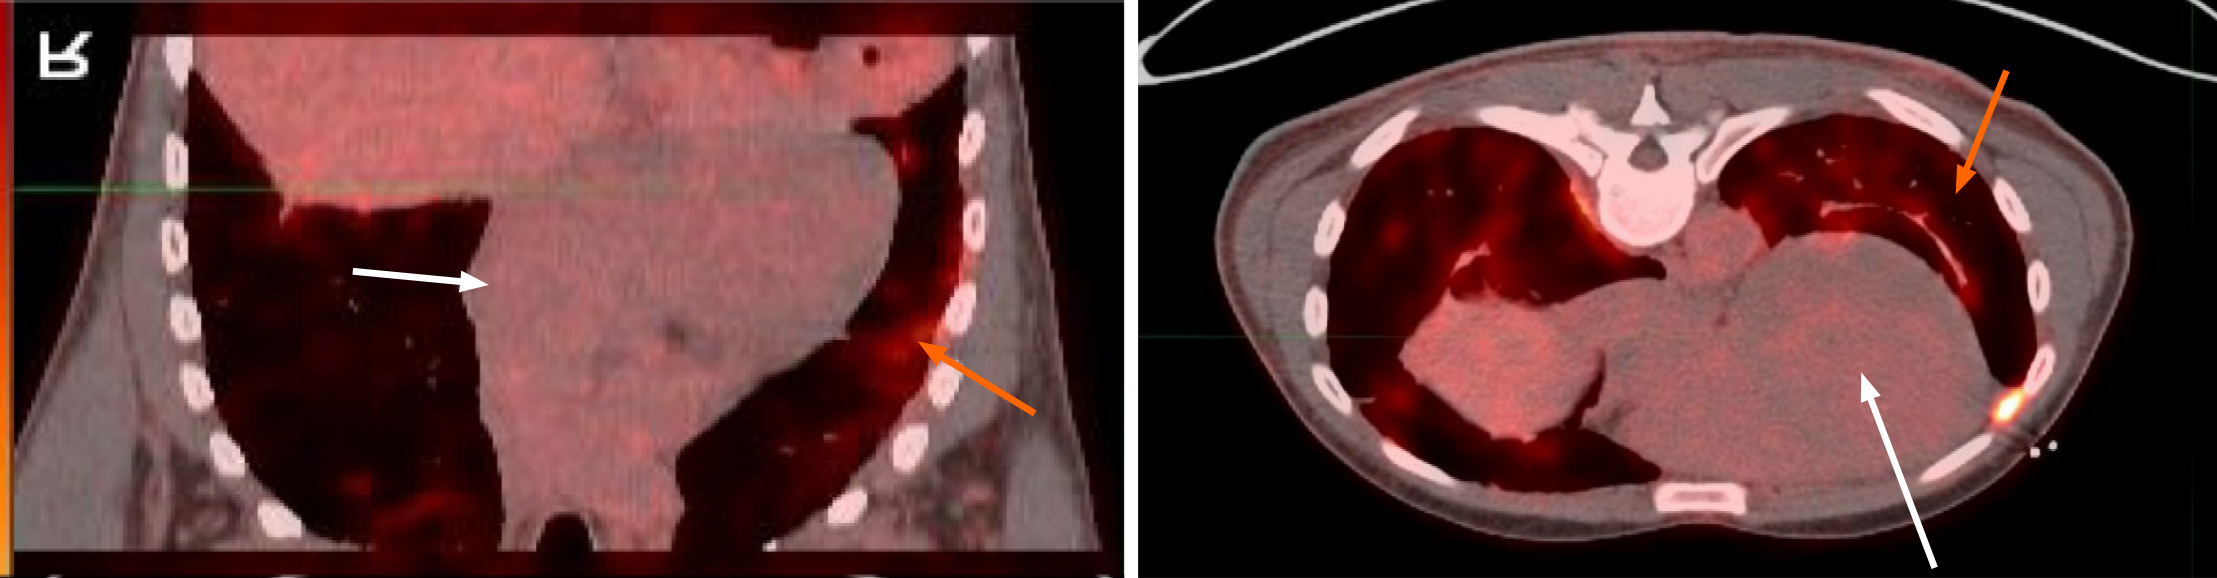
Figure 5 Positron emission tomography.
Scans of heart and lungs. Variation in inflammation is demonstrable by fluorodeoxyglucose uptake differences. Uptake + in lungs (orange arrow) and – in heart (white arrow).
- Citation: Khasnavis S, Sakul S, Novakovic M, Adinugraha P, Mehta D. Cardiac sarcoidosis with a twist - active and fibrotic sarcoid with antiphospholipid positivity: A case report. World J Cardiol 2025; 17(12): 112389
- URL: https://www.wjgnet.com/1949-8462/full/v17/i12/112389.htm
- DOI: https://dx.doi.org/10.4330/wjc.v17.i12.112389