
















©The Author(s) 2025.
World J Cardiol. Nov 26, 2025; 17(11): 109739
Published online Nov 26, 2025. doi: 10.4330/wjc.v17.i11.109739
Published online Nov 26, 2025. doi: 10.4330/wjc.v17.i11.109739
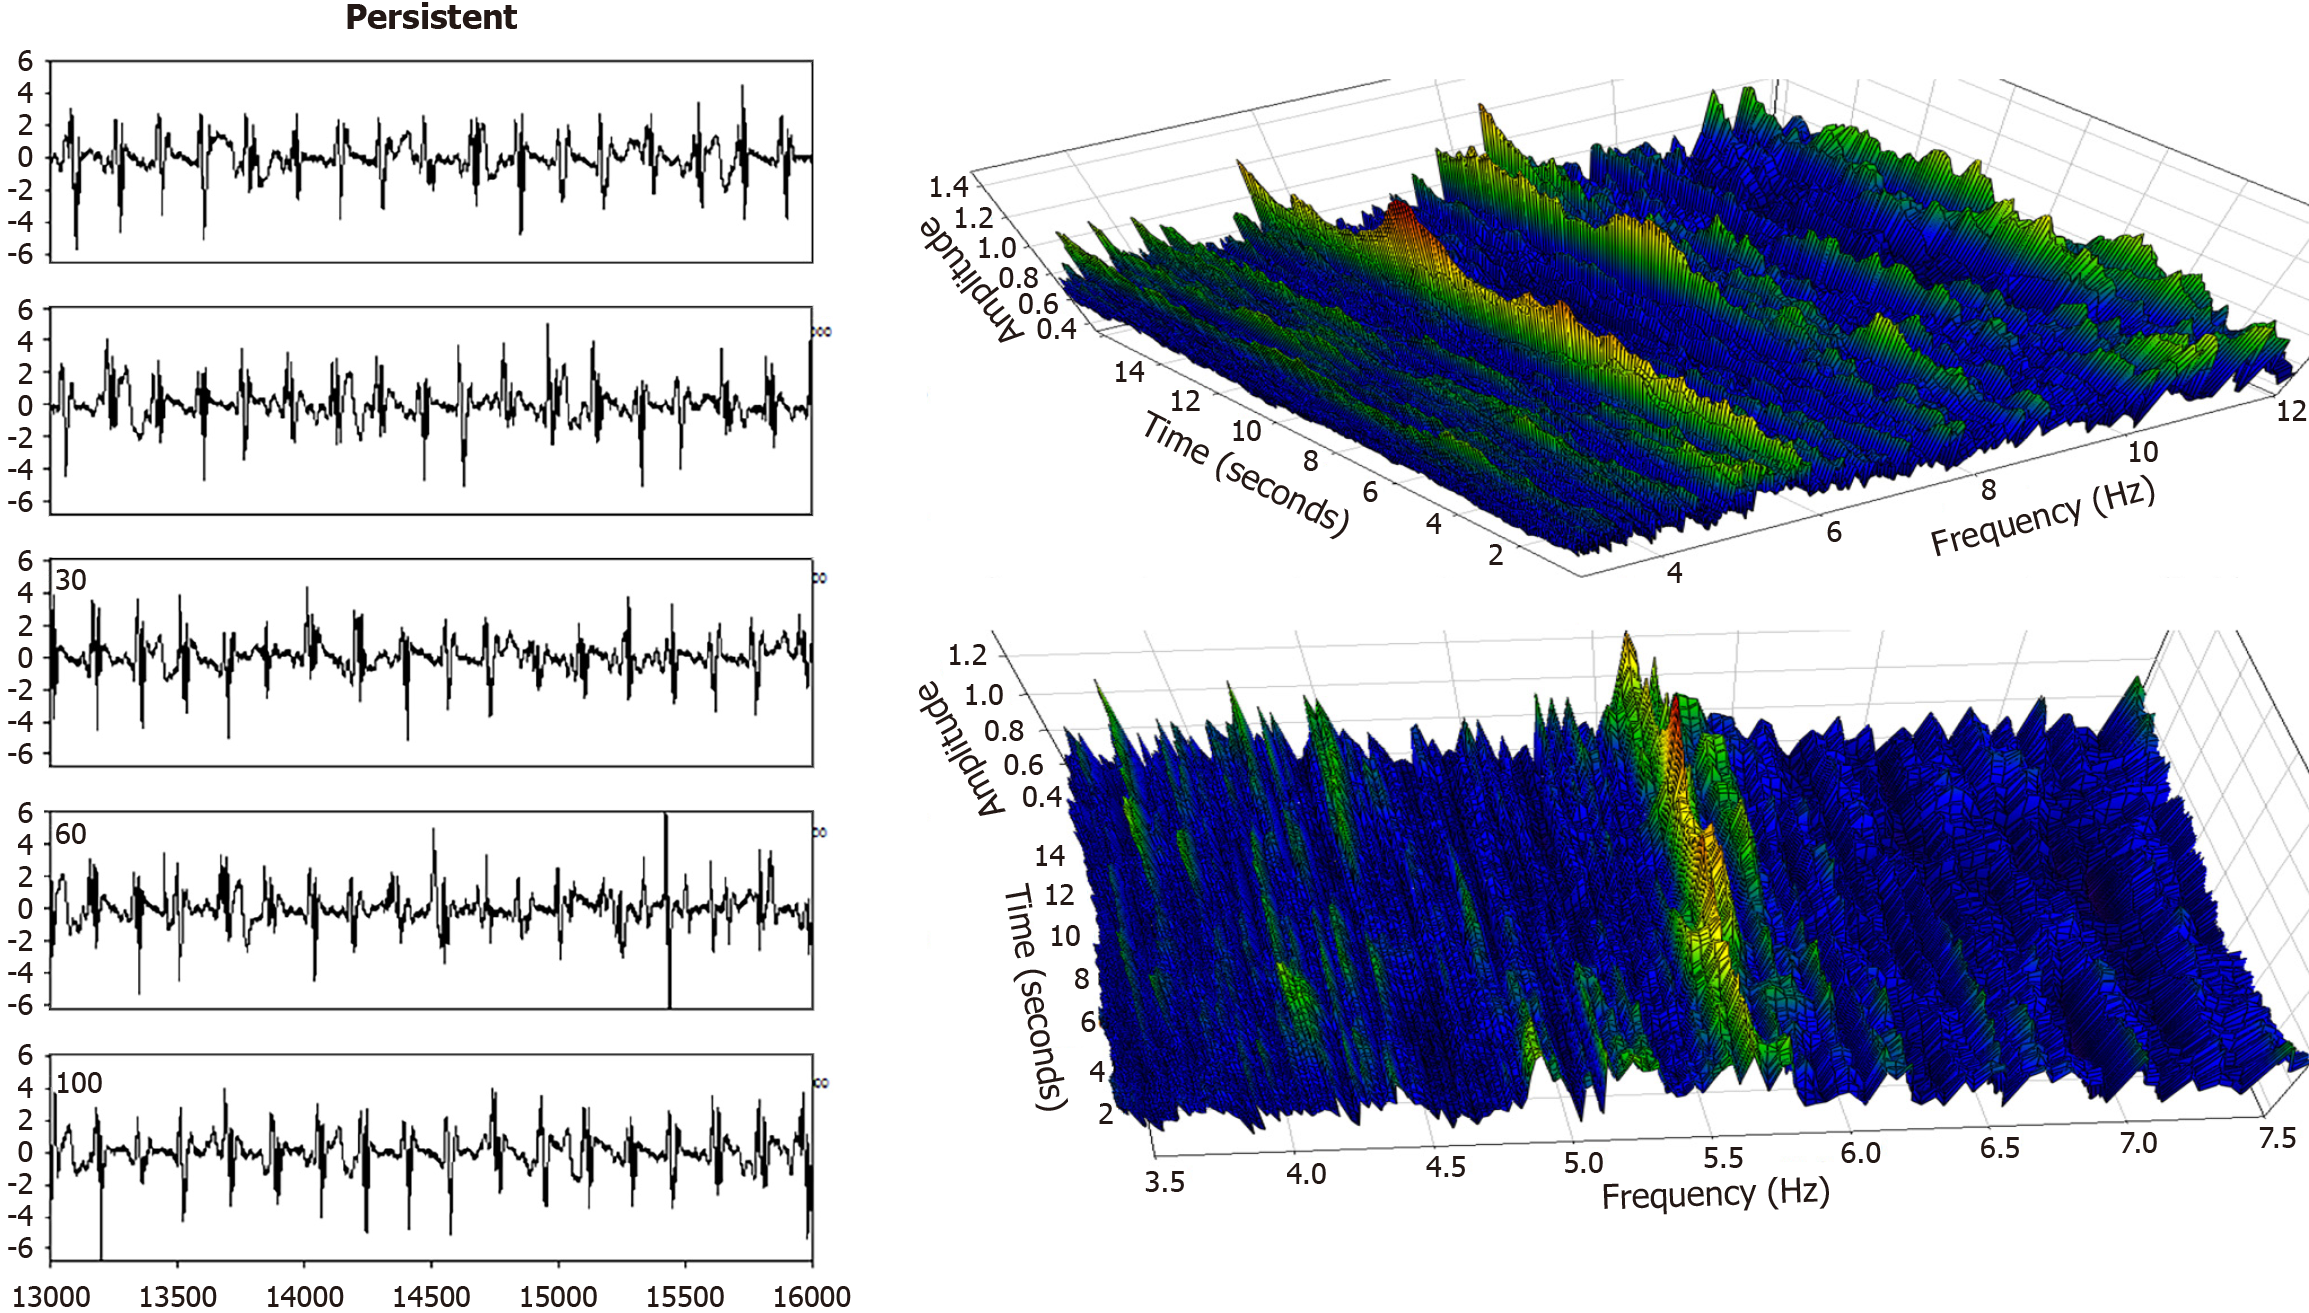
Figure 5 Left panel-successive time series segments from an atrial fibrillation recording in a persistent atrial fibrillation patient, anterior free wall.
The electrogram morphology is highly variable from one cycle to the next, yet the individual cycles are distinguishable, and the cycle length is evident. This observation translates to a similar and approximately constant dominant frequency (DF) spectrum (right panels) which is highlighted as the highest amplitude value (red, orange, and yellow color) over time. The DF for this persistent atrial fibrillation patient is therefore on the order of approximately 5.7 Hz, but it varies and bifurcates.
- Citation: Ciaccio EJ, Hsia HH, Yarmohammadi H, Wan EY, Peters NS, Saluja D, Biviano AB. Atrial fibrillation substrate mapping with emphasis on voltage-based guidance. World J Cardiol 2025; 17(11): 109739
- URL: https://www.wjgnet.com/1949-8462/full/v17/i11/109739.htm
- DOI: https://dx.doi.org/10.4330/wjc.v17.i11.109739