
















©The Author(s) 2025.
World J Cardiol. Nov 26, 2025; 17(11): 109739
Published online Nov 26, 2025. doi: 10.4330/wjc.v17.i11.109739
Published online Nov 26, 2025. doi: 10.4330/wjc.v17.i11.109739
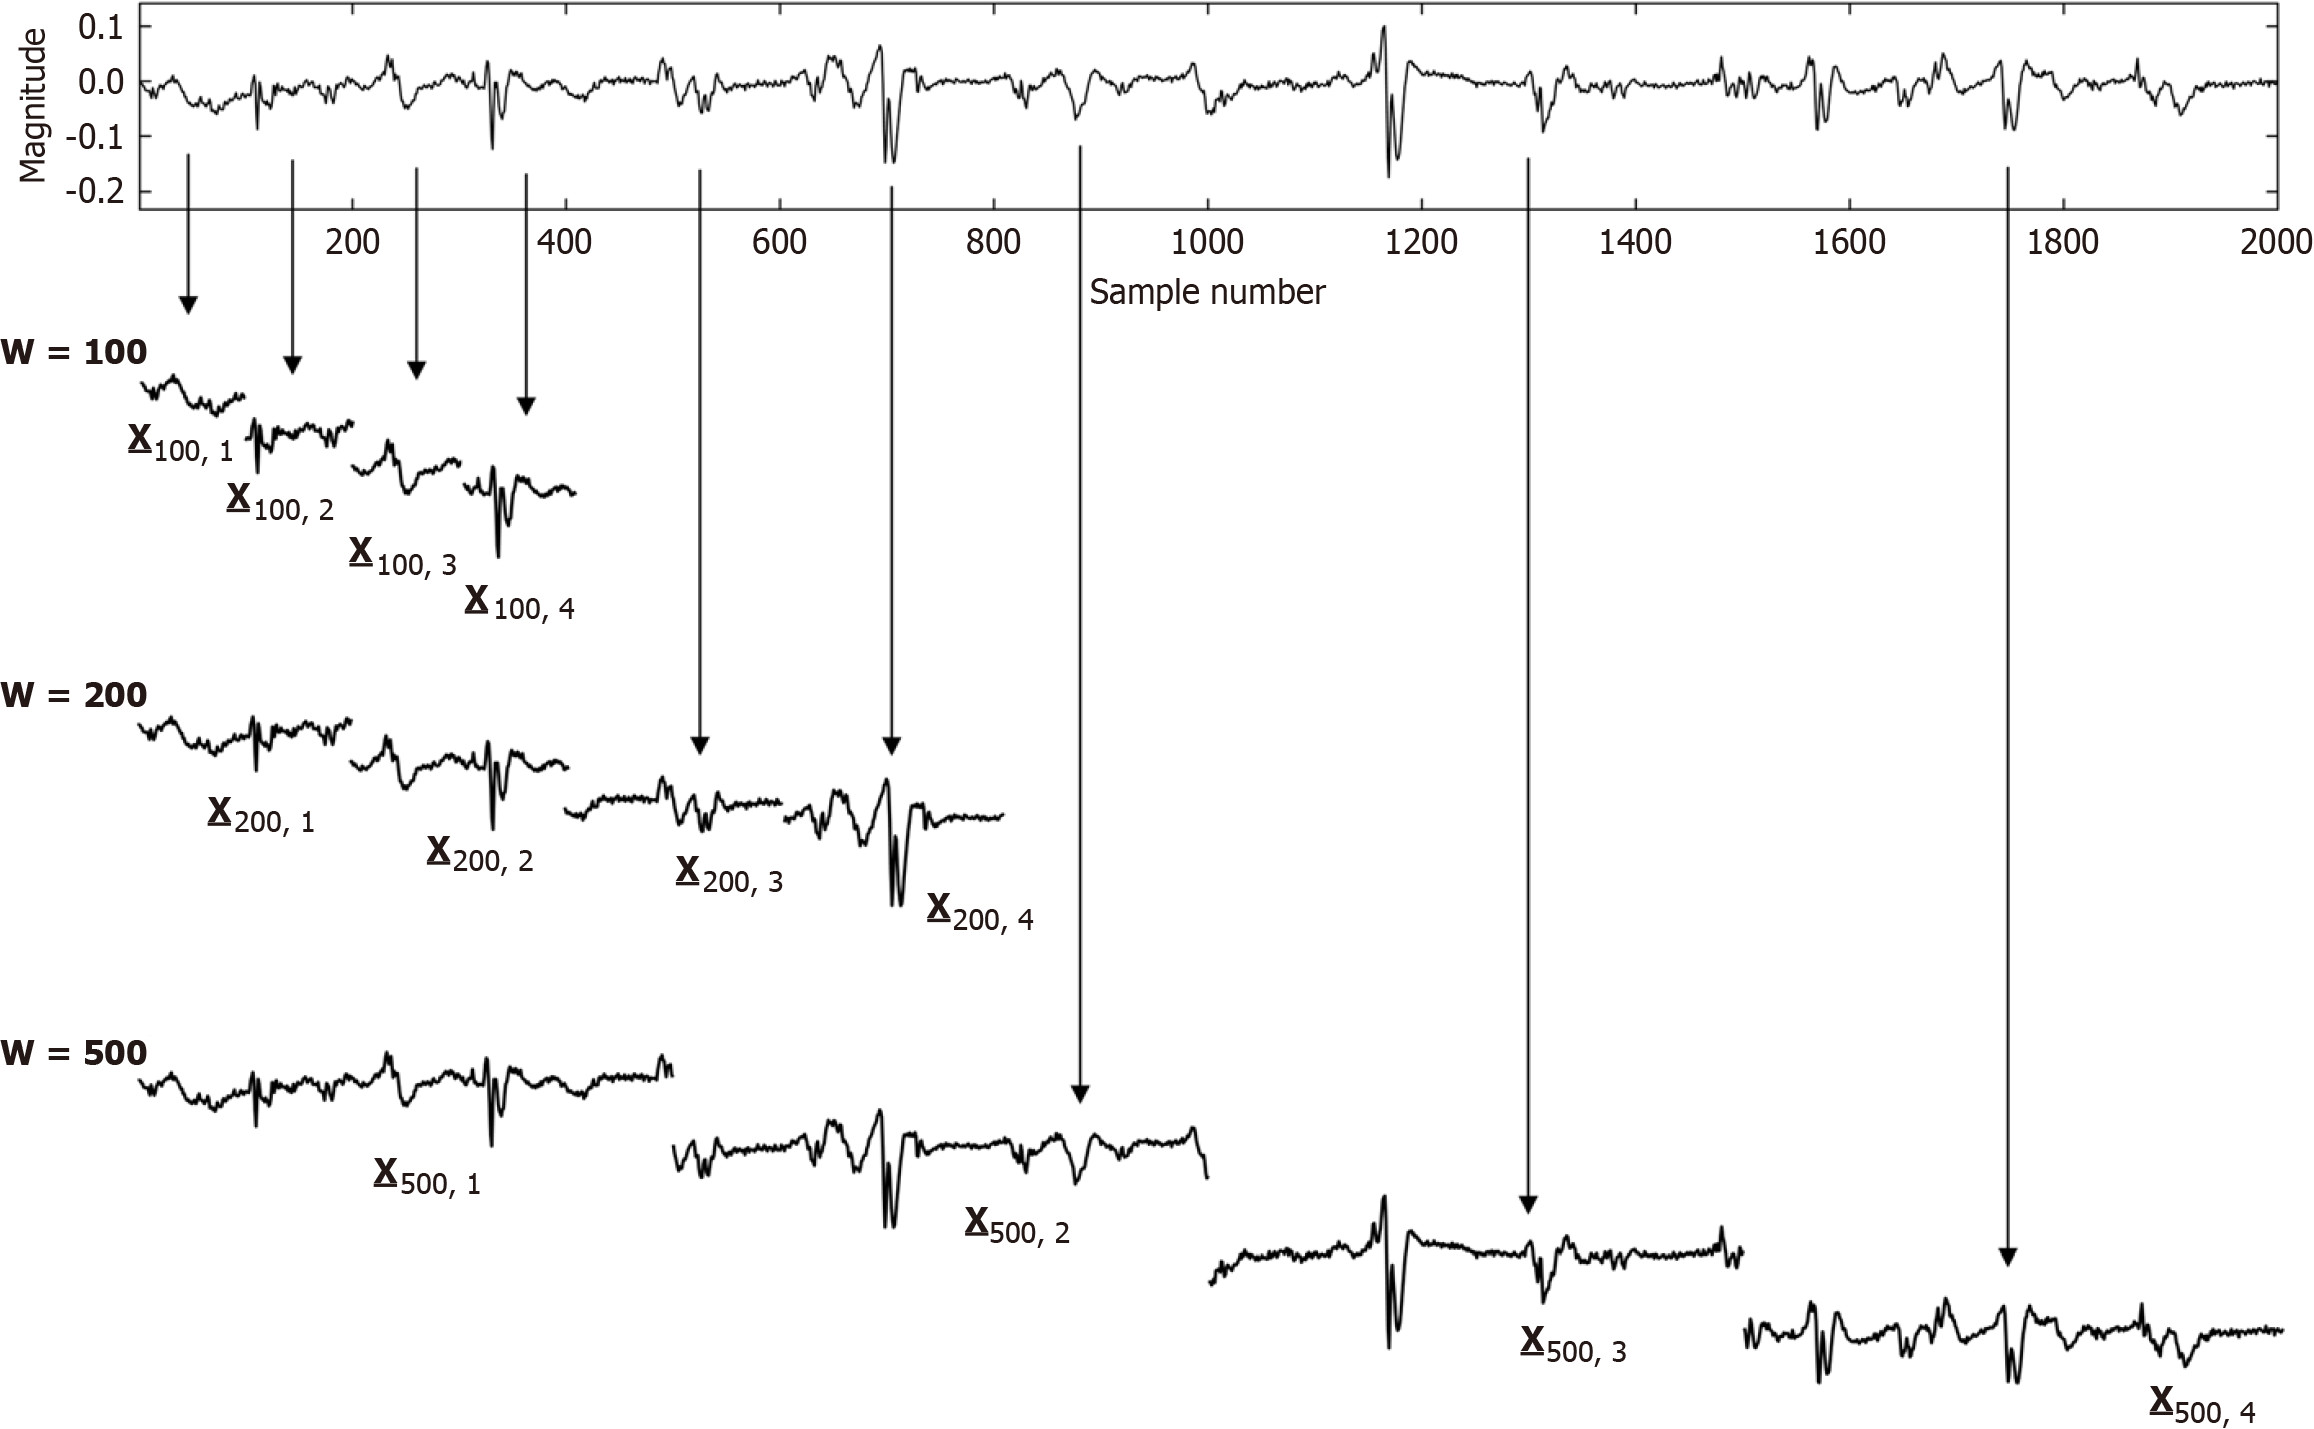
Figure 4 An example atrial fibrillation electrogram is shown in the top graph with variable deflection rate and morphology.
The ensemble mean or average of electrogram signal segments of length w can be determined from such a signal. The signal can be segmented using a window width w, where frequency = 1/w. For each w, the signal segments can be summed to compute spectral power at that frequency. This method, an alternate to Fourier analysis, is termed the Novel or New Spectral Estimator. The dominant frequency or DF so computed (peak frequency) describes the power at the activation rate of the signal. Greater power reflects those larger portions of the substrate in the field of view of the bipolar electrode activating at time intervals w, i.e. the coupling interval or cycle length. Since activation is randomized, it is likely indicative of the local refractory period, with longer coupling intervals portending longer local refractory periods.
- Citation: Ciaccio EJ, Hsia HH, Yarmohammadi H, Wan EY, Peters NS, Saluja D, Biviano AB. Atrial fibrillation substrate mapping with emphasis on voltage-based guidance. World J Cardiol 2025; 17(11): 109739
- URL: https://www.wjgnet.com/1949-8462/full/v17/i11/109739.htm
- DOI: https://dx.doi.org/10.4330/wjc.v17.i11.109739