
















©The Author(s) 2025.
World J Cardiol. Nov 26, 2025; 17(11): 109739
Published online Nov 26, 2025. doi: 10.4330/wjc.v17.i11.109739
Published online Nov 26, 2025. doi: 10.4330/wjc.v17.i11.109739
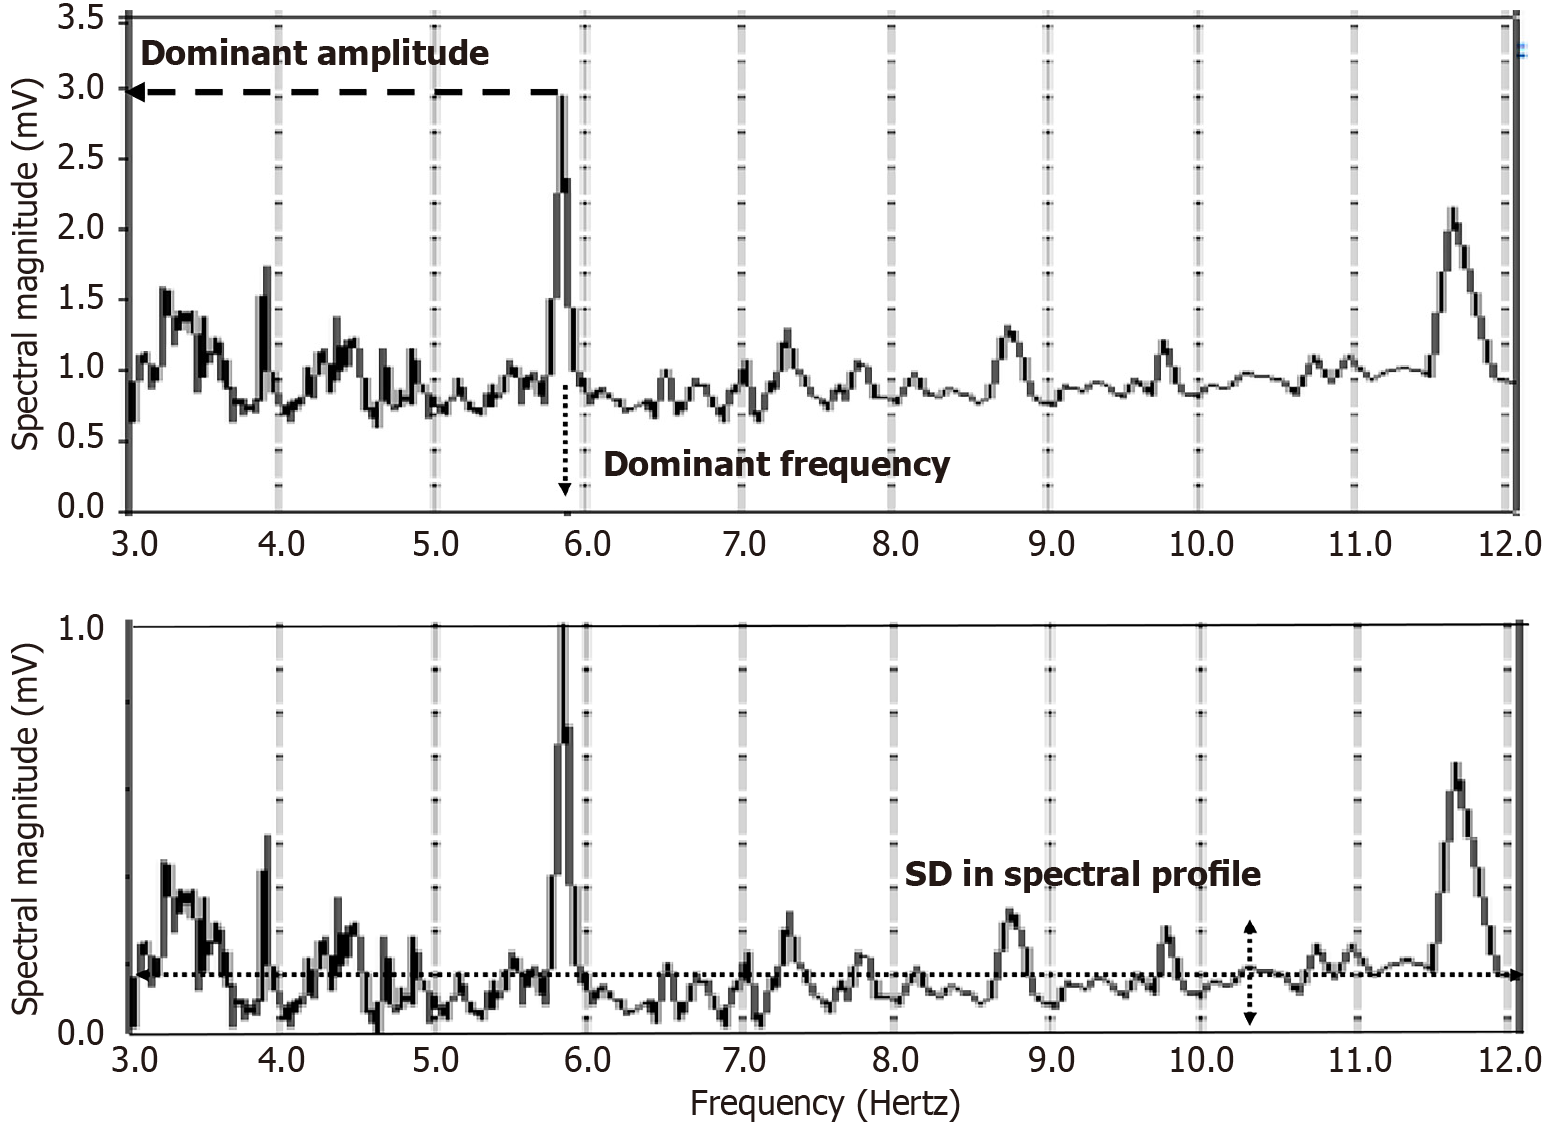
Figure 2 An example frequency spectrum (top panel) generated from an atrial electrogram which was acquired during atrial fibrillation in a persistent atrial fibrillation patient.
The largest spectral peak in the physiologic range of interest, typically 3–12 Hz, which is not a harmonic, is defined as the dominant frequency or DF. The amplitude or magnitude of that frequency component is labeled the dominant amplitude or DA. Two other parameters can be described by first normalizing the range of the ordinate axis to 0–1 mV (bottom panel). The mean value of this normalized frequency spectrum is termed the mean spectral profile (MP), and its SD is labeled the spectral profile (SP). The MP will be larger when the atrial electrogram is more random, such that there is no predominant spectral peak. The SP will tend to increase as the number of spectral components of varying amplitudes increases.
- Citation: Ciaccio EJ, Hsia HH, Yarmohammadi H, Wan EY, Peters NS, Saluja D, Biviano AB. Atrial fibrillation substrate mapping with emphasis on voltage-based guidance. World J Cardiol 2025; 17(11): 109739
- URL: https://www.wjgnet.com/1949-8462/full/v17/i11/109739.htm
- DOI: https://dx.doi.org/10.4330/wjc.v17.i11.109739