Copyright
©The Author(s) 2020.
World J Cardiol. Sep 26, 2020; 12(9): 468-474
Published online Sep 26, 2020. doi: 10.4330/wjc.v12.i9.468
Published online Sep 26, 2020. doi: 10.4330/wjc.v12.i9.468
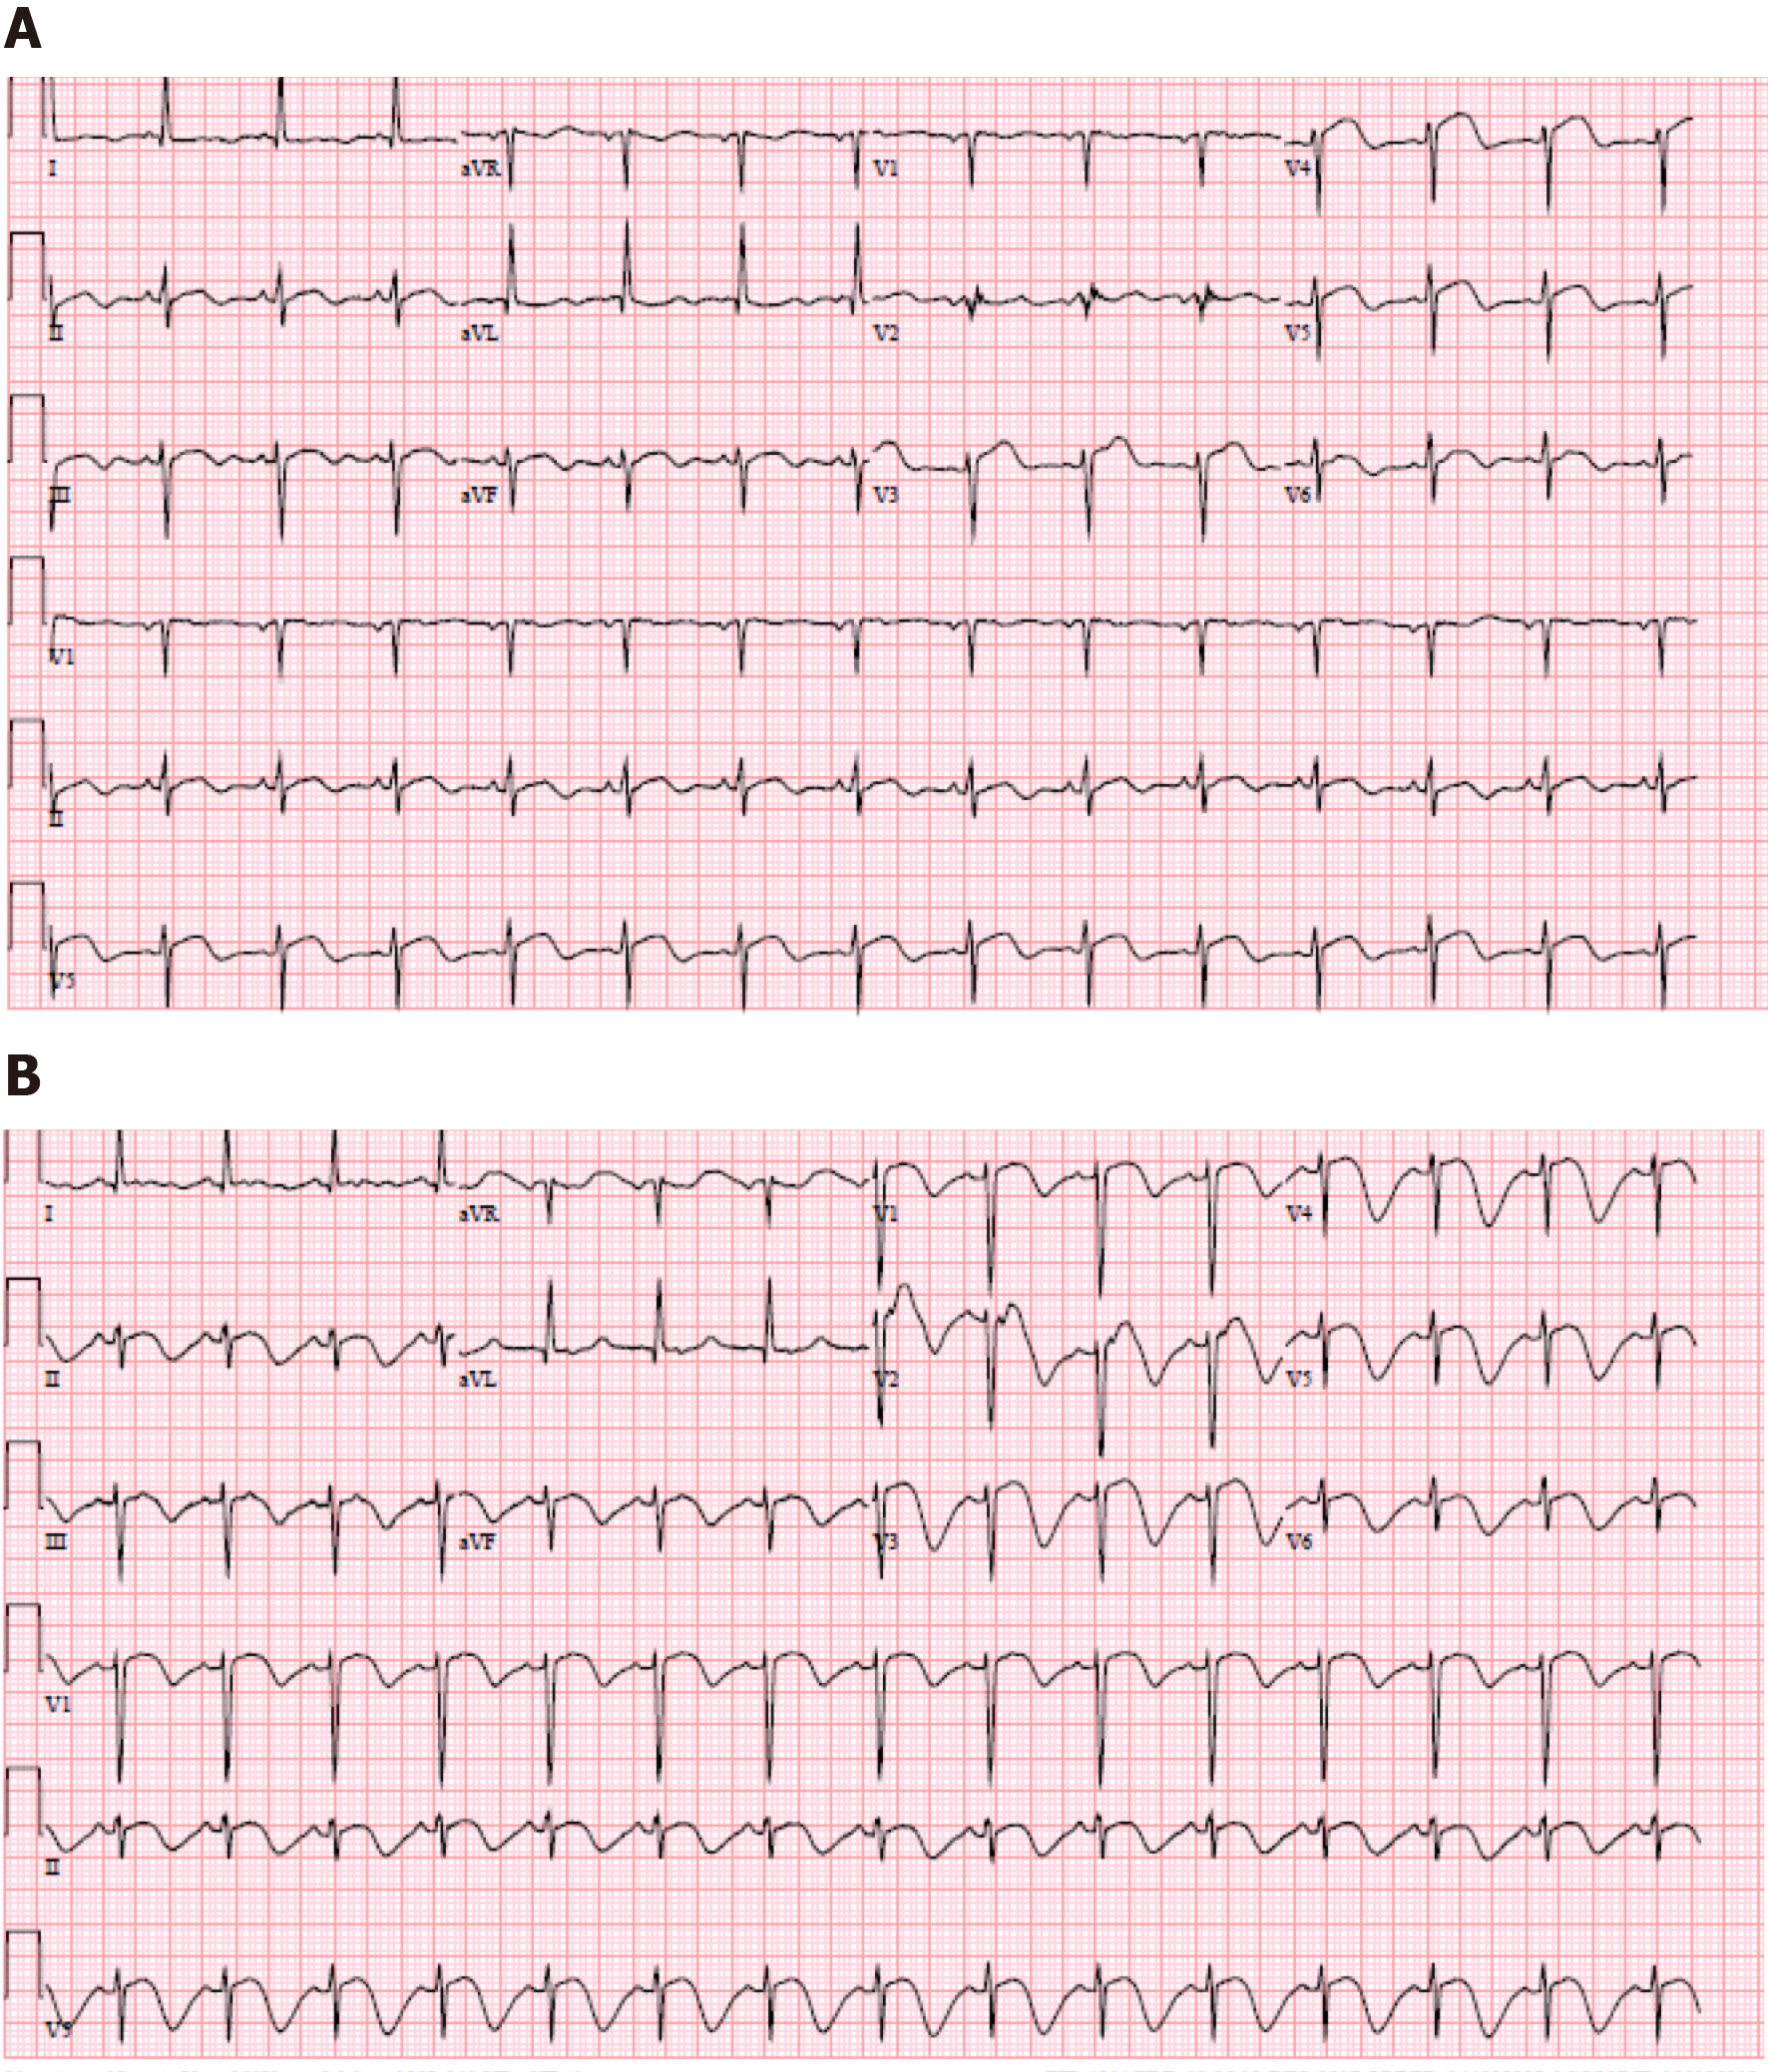
Figure 1 Electrocardiogram.
A: Electrocardiogram (ECG) showing ST elevations in leads V3-V5, and evidence of left ventricular hypertrophy with repolarization abnormality and prolonged QTc. B: ECG showing normal sinus rhythm with ST elevations in V1-V3 with deep T-wave inversions in the anterior-septal leads.
- Citation: Grewal D, Mohammad A, Swamy P, Abudayyeh I, Mamas MA, Parwani P. Diffuse coronary artery vasospasm in a patient with subarachnoid hemorrhage: A case report. World J Cardiol 2020; 12(9): 468-474
- URL: https://www.wjgnet.com/1949-8462/full/v12/i9/468.htm
- DOI: https://dx.doi.org/10.4330/wjc.v12.i9.468


