Copyright
©The Author(s) 2018.
World J Cardiol. Sep 26, 2018; 10(9): 97-109
Published online Sep 26, 2018. doi: 10.4330/wjc.v10.i9.97
Published online Sep 26, 2018. doi: 10.4330/wjc.v10.i9.97
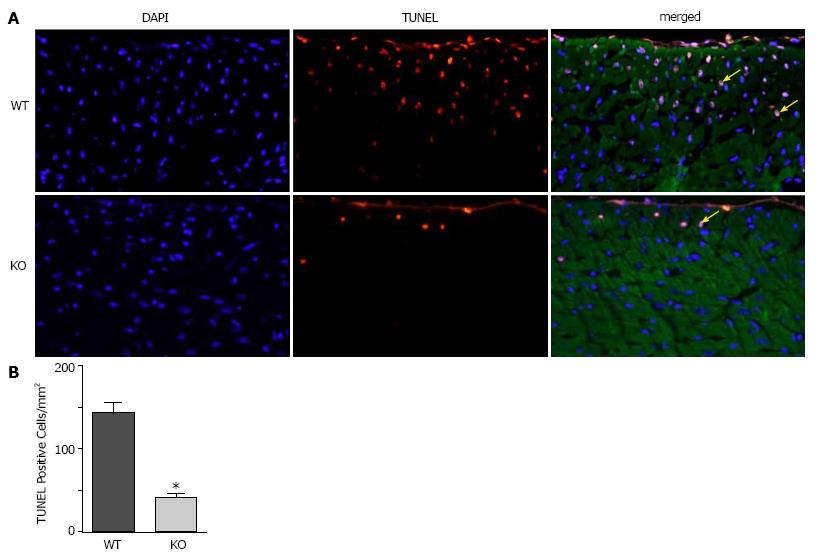
Figure 4 TUNEL staining to quantify apoptosis in WT and KO heart sections after ischemia and reperfusion.
Mice were subjected to 30 min of ischemia by occlusion of the LAD, followed by 3 h of reperfusion, and heart sections were processed to analyze apoptosis. A: Representative images from WT and KO heart sections, taken from a region approximately 1 mm distal to the occlusion site, showing nuclei stained with DAPI (blue), TUNEL (red) and sarcomeric actin (green). Yellow arrows point to apoptotic nuclei (pink); B: Quantification of apoptotic nuclei. n = 4 mice of each genotype, P ≤ 0.05.
- Citation: Vairamani K, Prasad V, Wang Y, Huang W, Chen Y, Medvedovic M, Lorenz JN, Shull GE. NBCe1 Na+-HCO3- cotransporter ablation causes reduced apoptosis following cardiac ischemia-reperfusion injury in vivo. World J Cardiol 2018; 10(9): 97-109
- URL: https://www.wjgnet.com/1949-8462/full/v10/i9/97.htm
- DOI: https://dx.doi.org/10.4330/wjc.v10.i9.97


