Copyright
©The Author(s) 2018.
World J Cardiol. Oct 26, 2018; 10(10): 153-164
Published online Oct 26, 2018. doi: 10.4330/wjc.v10.i10.153
Published online Oct 26, 2018. doi: 10.4330/wjc.v10.i10.153
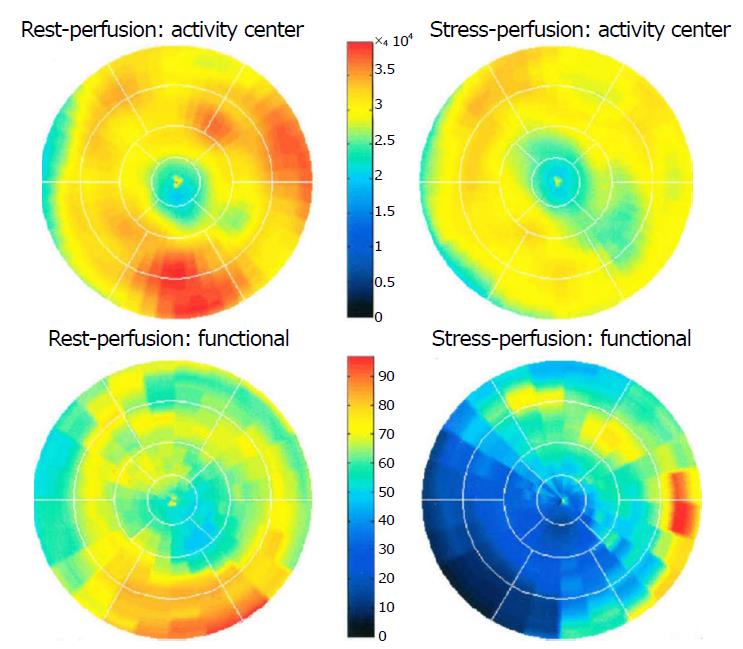
Figure 11 Positron emission tomography computed tomography scanning demonstrating normal findings on the rest 13N-ammonia polar map (left panel) and normal perfusion on adenosine 13N-ammonia polar map (right panel).
Myocardial perfusion was assessed at rest and during vasodilator pharmacological stress induced by adenosine, using 400 MBq of 13N-ammonia as the perfusion radiotracer.
- Citation: Said SA, Agool A, Moons AH, Basalus MW, Wagenaar NR, Nijhuis RL, Schroeder-Tanka JM, Slart RH. Incidental congenital coronary artery vascular fistulas in adults: Evaluation with adenosine-13N-ammonia PET-CT. World J Cardiol 2018; 10(10): 153-164
- URL: https://www.wjgnet.com/1949-8462/full/v10/i10/153.htm
- DOI: https://dx.doi.org/10.4330/wjc.v10.i10.153


