Copyright
©The Author(s) 2017.
World J Cardiol. Aug 26, 2017; 9(8): 693-701
Published online Aug 26, 2017. doi: 10.4330/wjc.v9.i8.693
Published online Aug 26, 2017. doi: 10.4330/wjc.v9.i8.693
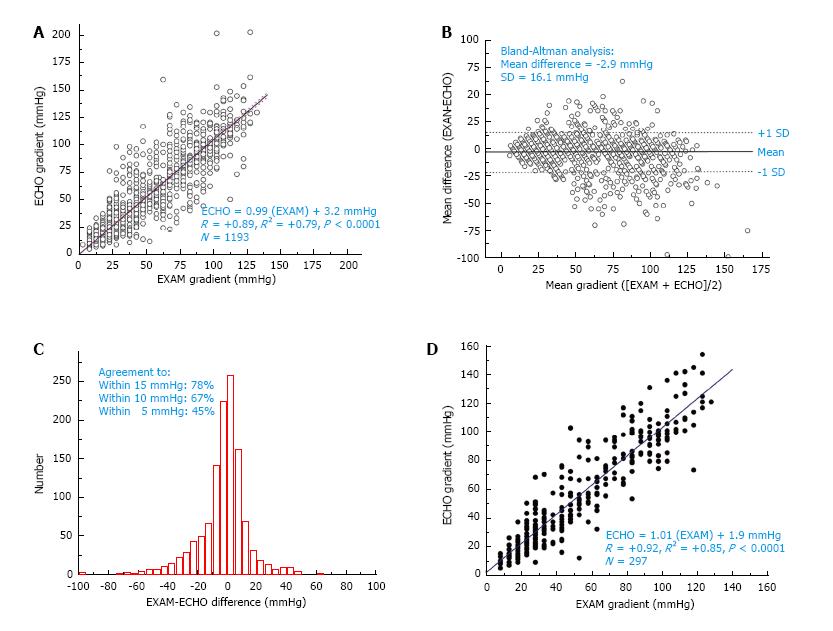
Figure 1 Accuracy and correlations of various congenital cardiac conditions.
A: Regression plot of all patients; B: Bland-Altman plot; C: Histogram displaying spread between the Doppler and physical examination gradients, and the agreement between Doppler and physical examination to within 15, 10, and 5 mmHg; D: Regression plot of most recent quartile of patients.
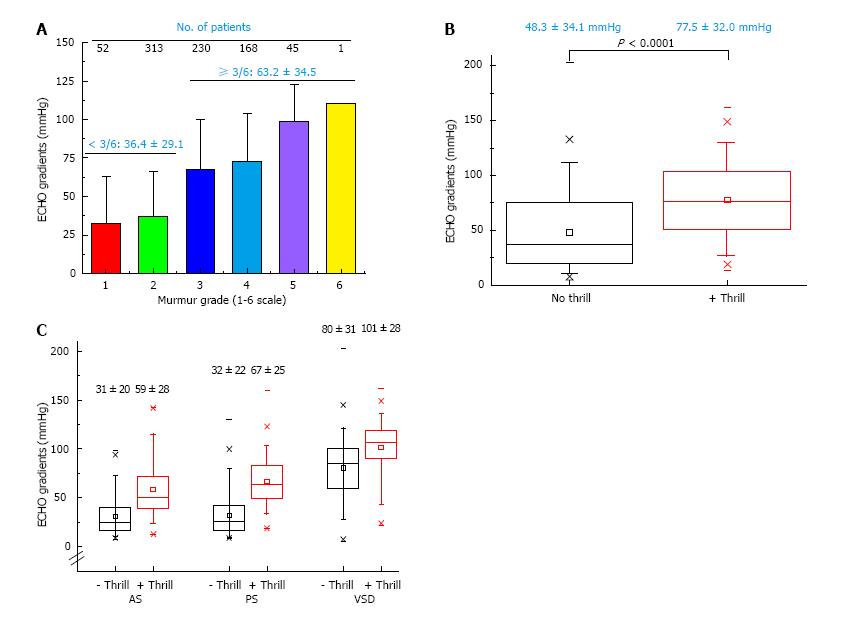
Figure 2 Correlates with patient factors affecting accuracy.
A: Loudness of heart murmur (standard grade system, 1-6) plotted against peak Doppler (“ECHO”) gradient; B: Box-and-whiskers plot of Doppler peak gradients in the absence and presence of a palpable thrill, all patients; C: Box-and-whiskers plots of specific congenital lesions (aortic stenosis, pulmonic stenosis, ventricular septal defect), thrill absent vs thrill present.
- Citation: Kadle RL, Phoon CKL. Estimating pressure gradients by auscultation: How technology (echocardiography) can help improve clinical skills. World J Cardiol 2017; 9(8): 693-701
- URL: https://www.wjgnet.com/1949-8462/full/v9/i8/693.htm
- DOI: https://dx.doi.org/10.4330/wjc.v9.i8.693


