Copyright
©The Author(s) 2017.
World J Cardiol. May 26, 2017; 9(5): 457-465
Published online May 26, 2017. doi: 10.4330/wjc.v9.i5.457
Published online May 26, 2017. doi: 10.4330/wjc.v9.i5.457
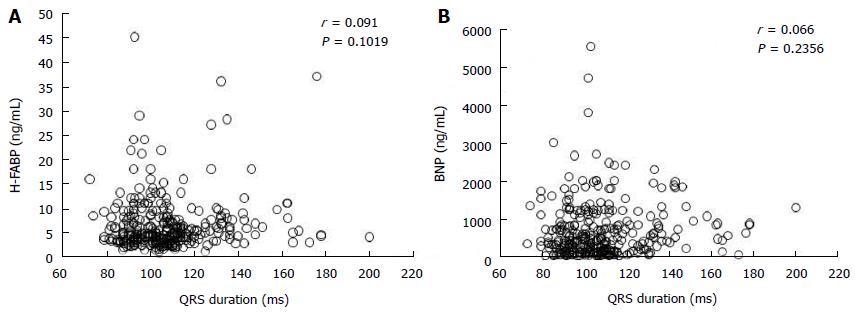
Figure 1 Relationship between QRS duration and heart-type fatty acid binding protein levels (A) and brain natriuretic protein levels (B).
BNP: Brain natriuretic peptide; H-FABP: Heart-type fatty acid-binding protein.
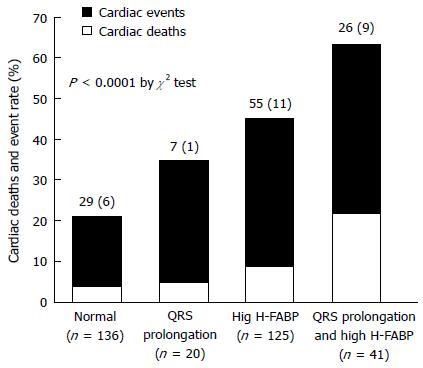
Figure 2 Cardiac mortality and all cardiac events among the four groups based on heart-type fatty acid-binding protein level and QRS duration.
Normal group (n = 136), H-FABP ≤ 4.5 ng/mL and QRS duration < 120 ms; QRS prolongation group (n = 20), H-FABP ≤ 4.5 ng/mL and QRS duration ≥ 120 ms; high H-FABP group (n = 125), H-FABP > 4.5 ng/mL and QRS duration < 120 ms; and high H-FABP + QRS prolongation group (n = 41), H-FABP > 4.5 ng/mL and QRS duration ≥ 120 ms. H-FABP: Heart-type fatty acid-binding protein.
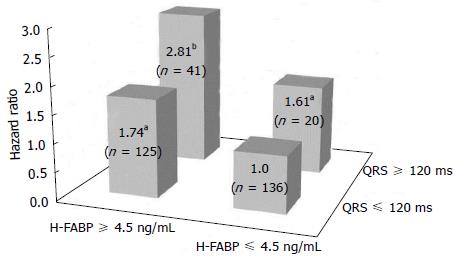
Figure 3 Hazard ratios relative to the normal group after adjustment for age, New York Heart Association functional class, brain natriuretic peptide level and estimated glomerular filtration rate.
aP < 0.05, bP < 0.01 vs normal group. H-FABP: Heart-type fatty acid-binding protein.
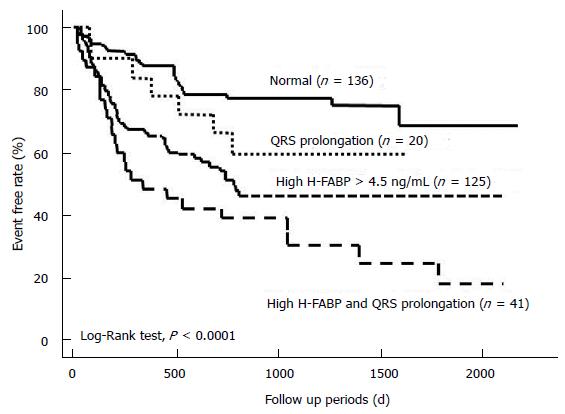
Figure 4 Kaplan-Meier analysis of the cardiac event-free curve in patients with chronic heart failure, who were stratified into four groups based on QRS duration and heart-type fatty acid-binding protein level.
H-FABP: Heart-type fatty acid-binding protein.
- Citation: Kadowaki S, Watanabe T, Otaki Y, Narumi T, Honda Y, Takahashi H, Arimoto T, Shishido T, Miyamoto T, Kubota I. Combined assessment of myocardial damage and electrical disturbance in chronic heart failure. World J Cardiol 2017; 9(5): 457-465
- URL: https://www.wjgnet.com/1949-8462/full/v9/i5/457.htm
- DOI: https://dx.doi.org/10.4330/wjc.v9.i5.457


