Copyright
©2014 Baishideng Publishing Group Inc.
World J Cardiol. Oct 26, 2014; 6(10): 1108-1112
Published online Oct 26, 2014. doi: 10.4330/wjc.v6.i10.1108
Published online Oct 26, 2014. doi: 10.4330/wjc.v6.i10.1108
Figure 1 Digital subtraction images of a myocardial region of interest illustrate the temporal distribution of grey level rise and venous washout of contrast agent during a coronary catheter image sequence.
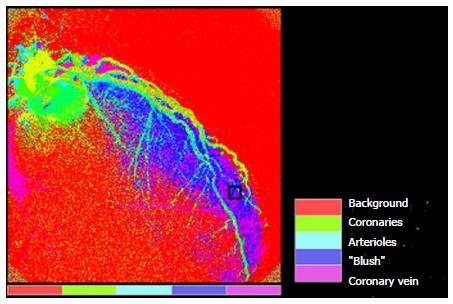
Figure 2 The parametric image shows coloured phases of cardiac perfusion in a combined presentation.
The arterial phase is followed by early and late myocardial infusion until the contrast agent arrives in the venous system.
Figure 3 Computer-assisted program illustrating post-interventional high myocardial blush grade after successful left anterior descending revascularization in a non-ST-elevation myocardial infarction patient.
- Citation: Hofmann NP, Dickhaus H, Katus HA, Korosoglou G. Quantitative assessment of myocardial blush grade in patients with coronary artery disease and in cardiac transplant recipients. World J Cardiol 2014; 6(10): 1108-1112
- URL: https://www.wjgnet.com/1949-8462/full/v6/i10/1108.htm
- DOI: https://dx.doi.org/10.4330/wjc.v6.i10.1108


