Copyright
©2011 Baishideng Publishing Group Co.
World J Cardiol. Nov 26, 2011; 3(11): 359-366
Published online Nov 26, 2011. doi: 10.4330/wjc.v3.i11.359
Published online Nov 26, 2011. doi: 10.4330/wjc.v3.i11.359
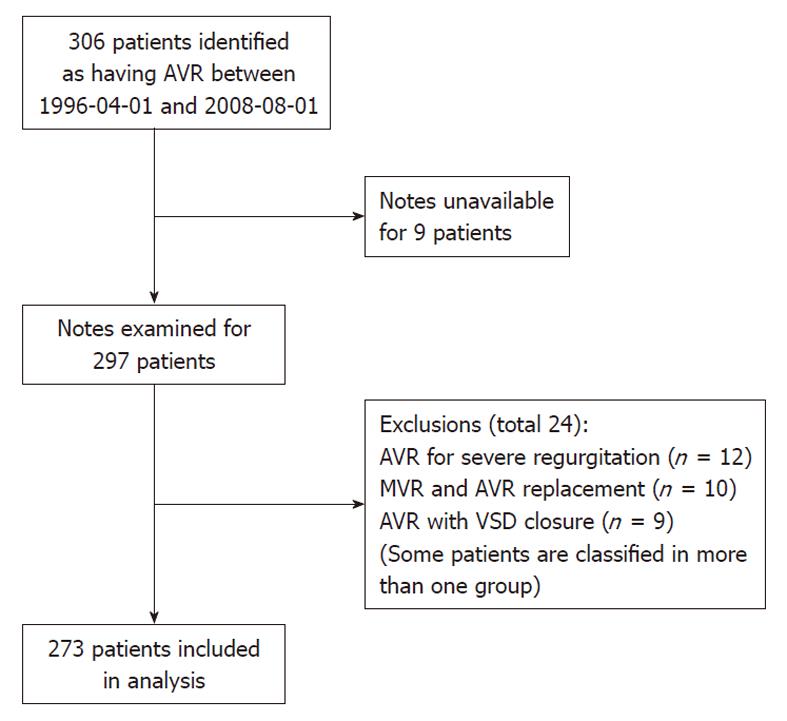
Figure 1 Flow chart of study enrollment.
The 9 patients for whom notes are unavailable: 5/9 were male (56%); Mortality-Nil; Age: mean (SD) = 83.9 (3.7), range = 80.2-92.1; EuroSCORE: Median (interquartile range) = 9 (8-10), range = 7 to 11. AVR: Aortic valve replacement; MVR: Mitral valve replacement; VSD: Ventricular septal defect.
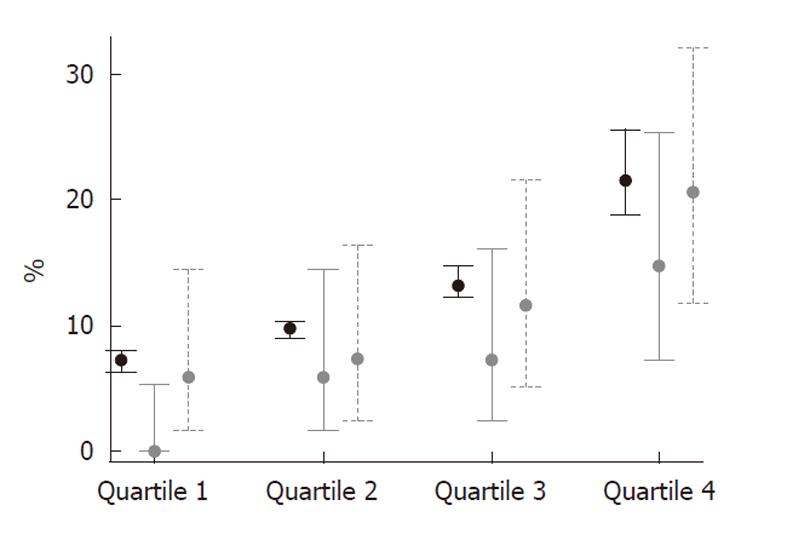
Figure 2 Logistic EuroSCORE, 30- and 90-d mortality by quartiles of Logistic EuroSCORE.
Black capped spikes represent median and quartiles of Logistic EuroSCORE (LES) (LES predicted overall mortality for quartiles: 7.8, 9.8, 13.6, 26.5); gray capped spikes represent the percent 30-d (solid) and 90-d (dashed) mortality, with 95% CIs. Tests for trend: 30-d mortality, P = 0.001; 90-d mortality, P = 0.005. CI: Confidence interval.
Figure 3 Logistic EuroSCORE, 30-d and 90-d mortality by operative era.
Black capped spikes represent median and quartiles of Logistic EuroSCORE; gray capped spikes represent percent 30-d (solid) and 90-d (dashed) mortality, with 95% CIs. Bars represent the number of aortic valve replacement procedures. Tests for trend: 30-d mortality, P = 0.49; 90-d mortality, P = 0.34.
Figure 4 Kaplan-Meier survival curves.
A: Overall; B: For Logistic EuroSCORE (LES) < 15/LES ≥ 15; C: For aortic valve replacement (AVR)/AVR + coronary artery bypass grafting (CABG).
- Citation: Kesavan S, Iqbal A, Khan Y, Hutter J, Pike K, Rogers C, Turner M, Townsend M, Baumbach A. Risk profile and outcomes of aortic valve replacement in octogenarians. World J Cardiol 2011; 3(11): 359-366
- URL: https://www.wjgnet.com/1949-8462/full/v3/i11/359.htm
- DOI: https://dx.doi.org/10.4330/wjc.v3.i11.359


