Copyright
©The Author(s) 2023.
World J Cardiol. Nov 26, 2023; 15(11): 609-614
Published online Nov 26, 2023. doi: 10.4330/wjc.v15.i11.609
Published online Nov 26, 2023. doi: 10.4330/wjc.v15.i11.609
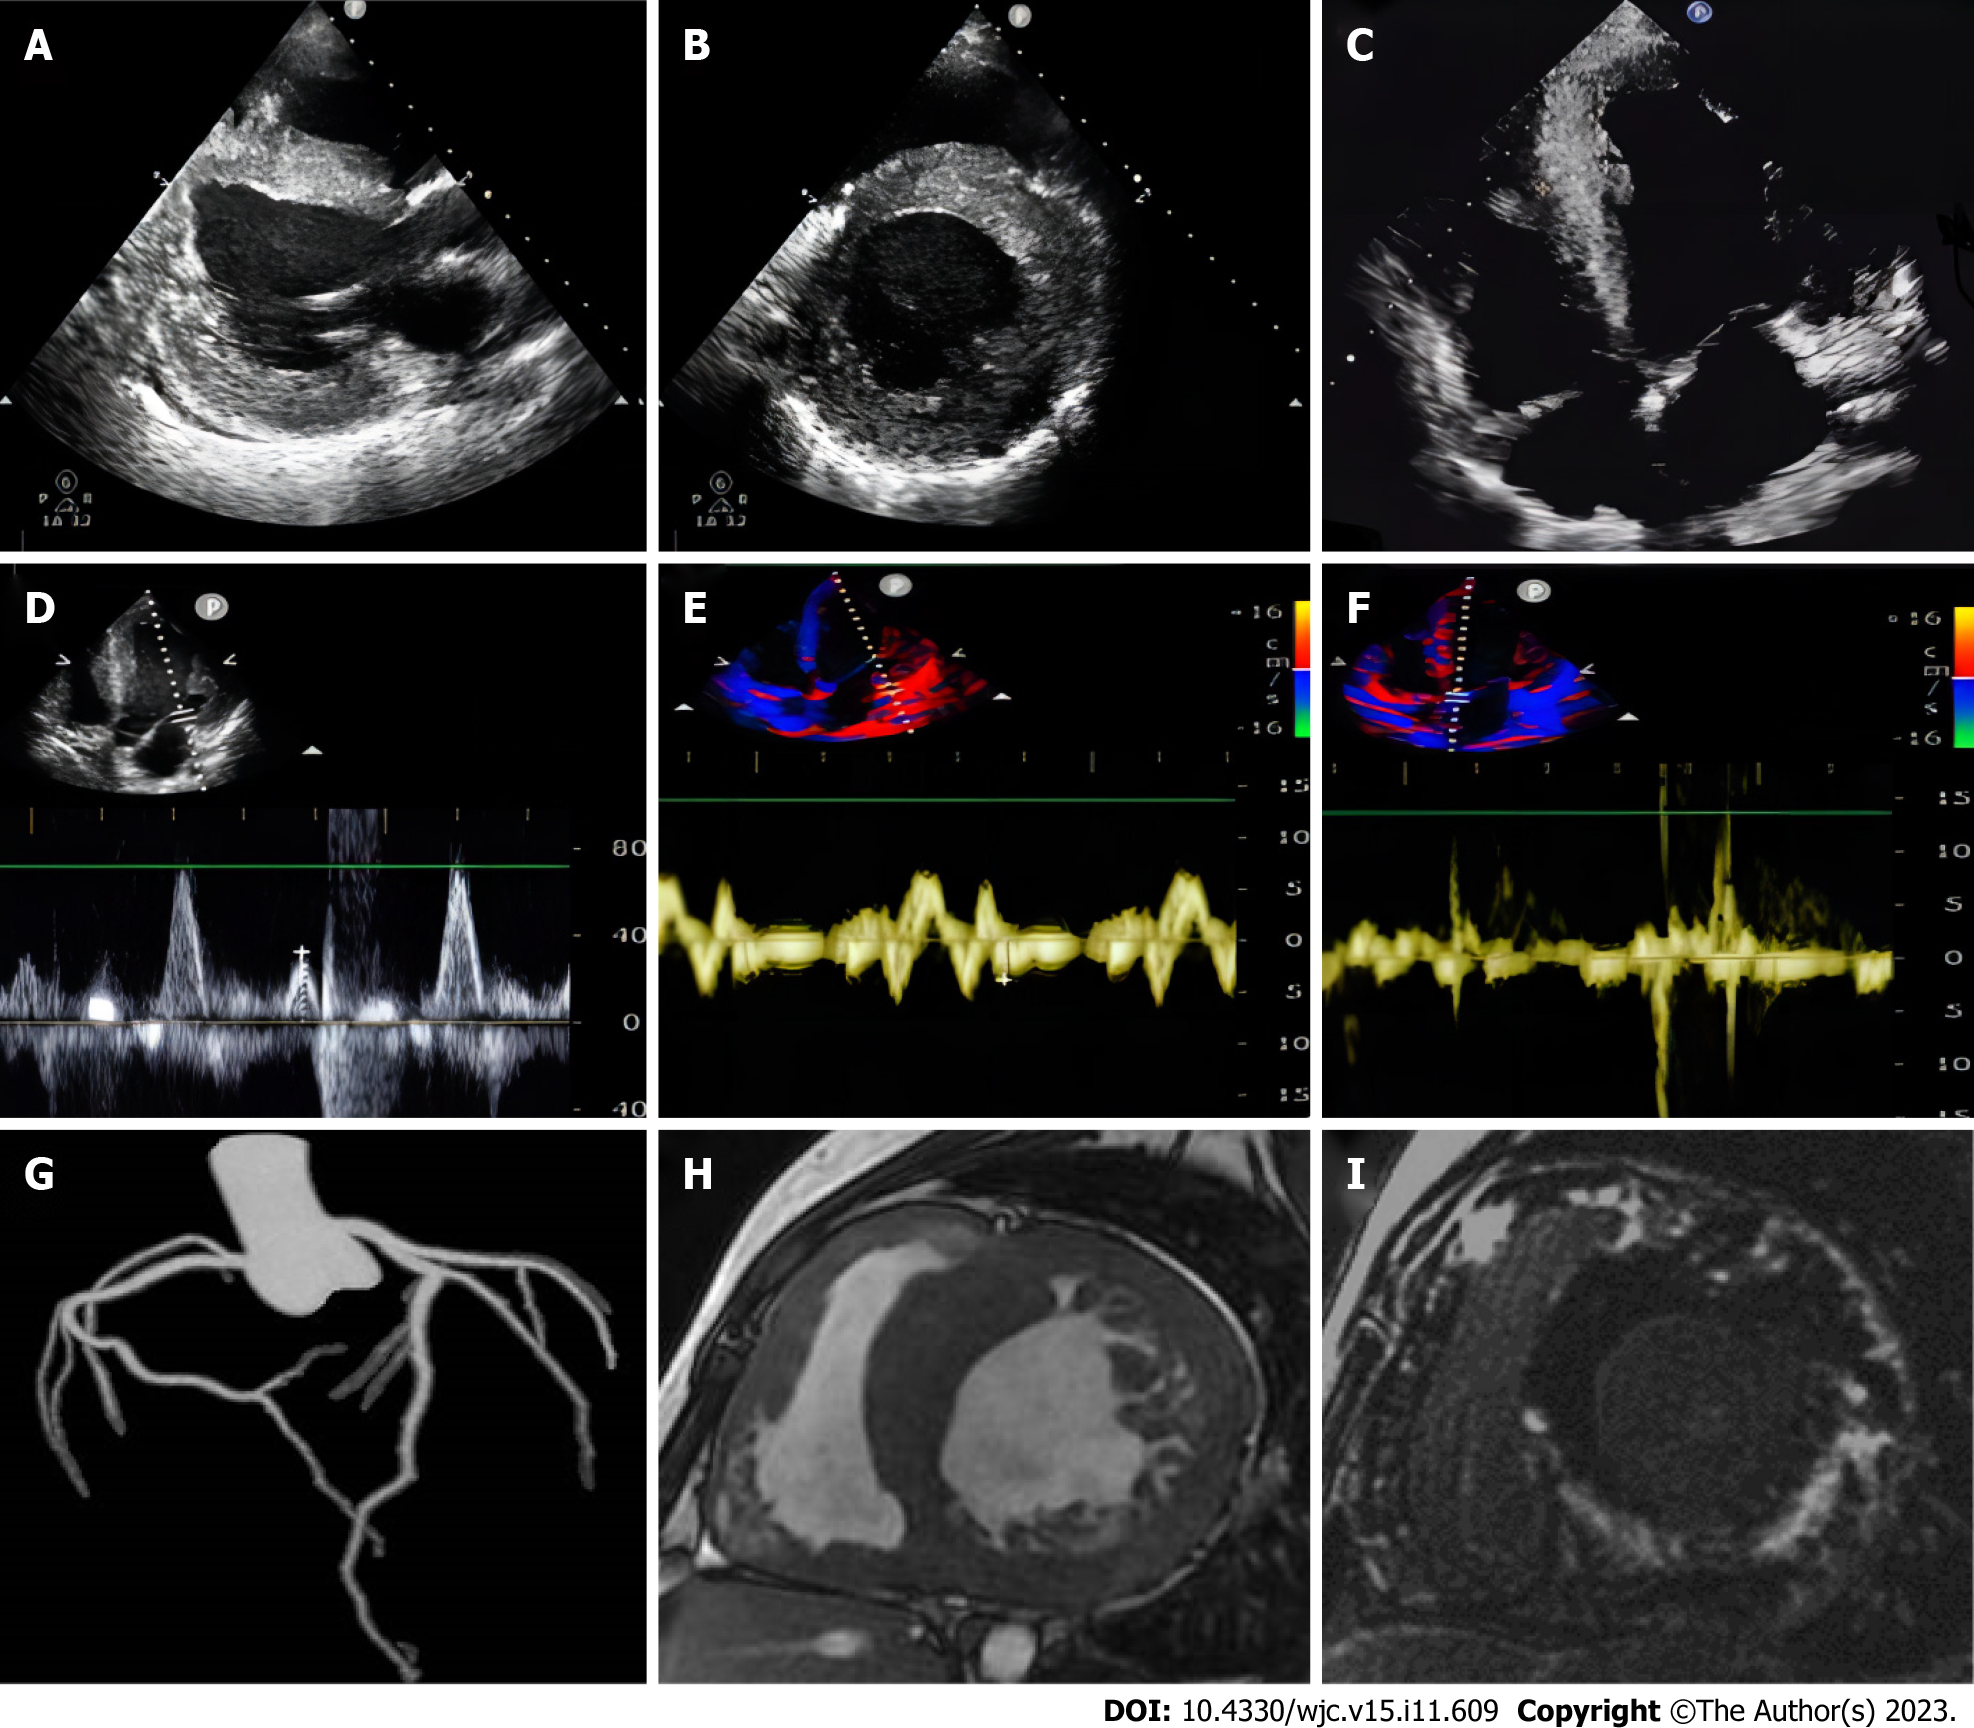
Figure 1 Imaging features of the male patient.
A: Transthoracic echocardiography shows left ventricular centripetal hypertrophy in parasternal long axis view; B: Transthoracic echocardiography shows left ventricular centripetal hypertrophy in parasternal short axis view; C: Transthoracic echocardiography shows left ventricular centripetal hypertrophy and right ventricular hypertrophy in long axis view; D: Tissue Doppler imaging shows increased end-diastolic filling pressure in the left ventricle, with an E value of 70 cm/second; E: Tissue Doppler imaging shows increased end-diastolic filling pressure in the left ventricle, with e' (lateral wall) value of 4 cm/second; F: Tissue Doppler imaging shows increased end-diastolic filling pressure in the left ventricle, with e' (ventricular septum) value of 3 cm/second; G: The coronary tree’s maximum intensity projection displays the patency of each branch lumen; H: Cardiac magnetic resonance short-axis cine shows diffuse thickening of the biventricular wall, excessive myocardial trabeculation, and pericardial effusion; I: Late gadolinium enhancement of the short axis demonstrates extensive late gadolinium enhancement of the biventricular wall, sparing only the basal segment septum.
Figure 2 Feature Tracking strain measurements.
A: Cardiac magnetic resonance feature tracking with longitudinal strain overlay on a four-chamber cine steady-state free procession image; B: Bull’s- eye diagram of strain in each segment in the left ventricular myocardium of the same patient; C: The map show the longitudinal strain values. The vertical axis shows longitudinal strain (%), and the horizontal axis shows the time in ms.
- Citation: Zhao YT, Cao XQ, Mu XL. Hypertrophic cardiomyopathy secondary to deficiency in lysosome-associated membrane protein-2: A case report. World J Cardiol 2023; 15(11): 609-614
- URL: https://www.wjgnet.com/1949-8462/full/v15/i11/609.htm
- DOI: https://dx.doi.org/10.4330/wjc.v15.i11.609


