Copyright
©The Author(s) 2020.
World J Cardiol. Apr 26, 2020; 12(4): 144-154
Published online Apr 26, 2020. doi: 10.4330/wjc.v12.i4.144
Published online Apr 26, 2020. doi: 10.4330/wjc.v12.i4.144
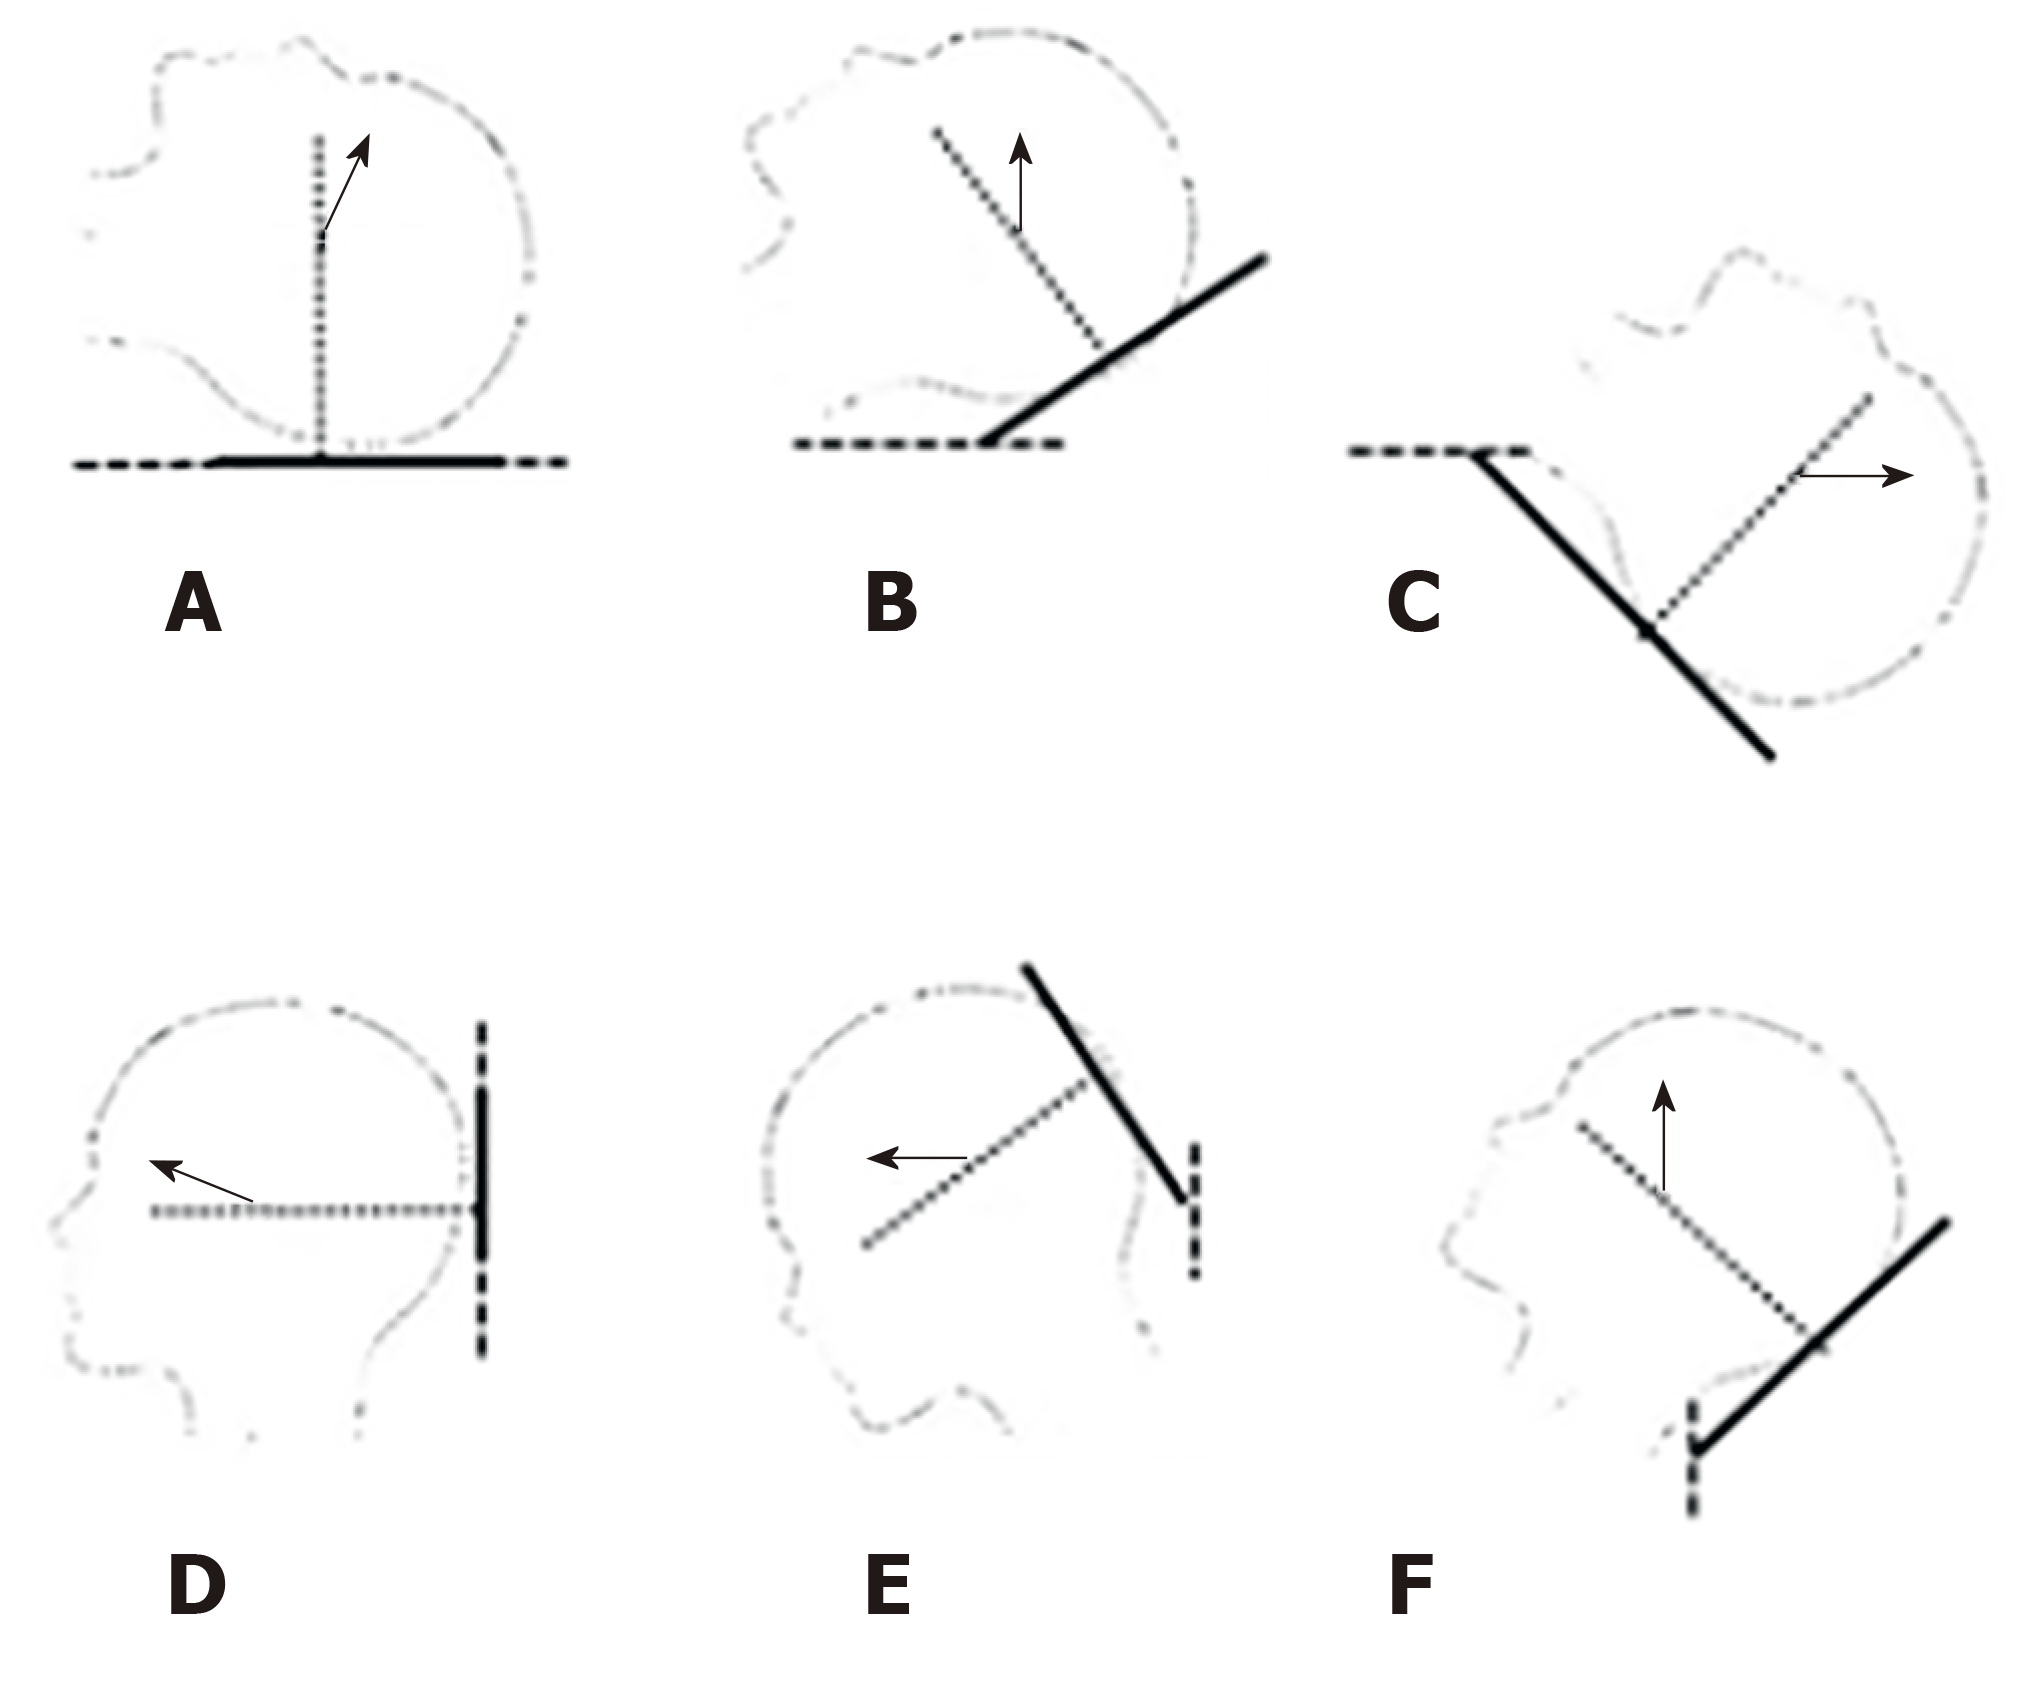
Figure 1 Schematic drawing of horizontal semi-circular canal axis and its alignment with gravity plane in supine and upright orientations.
A: Arrow shows the angle between horizontal canal and vertical line in supine position; B: Arrow shows the vertical position of horizontal canal following the 30˚ forward tilt in supine position e.g., the optimum position in supine state; C: Arrow shows the horizental position of horizontal canal following the 60˚ backward tilt in supine position e.g., the pessimum position in supine state; D: Arrow shows the angle between horizontal canal and horizental line in upright position; E: Arrow shows the horizental position of horizontal canal following the 30˚ forward tilt in upright position e.g., the pessimum position in upright state; F: Arrow shows the vertical position of horizontal canal following the 60˚ backward tilt in upright position e.g., the optimum position in upright state. In optimum position the horizontal canal axis is vertical and in the gravity plane (B and F). In pessimum position this axis is horizontal and eliminates the effect of gravity on endolymph convection (C and E).
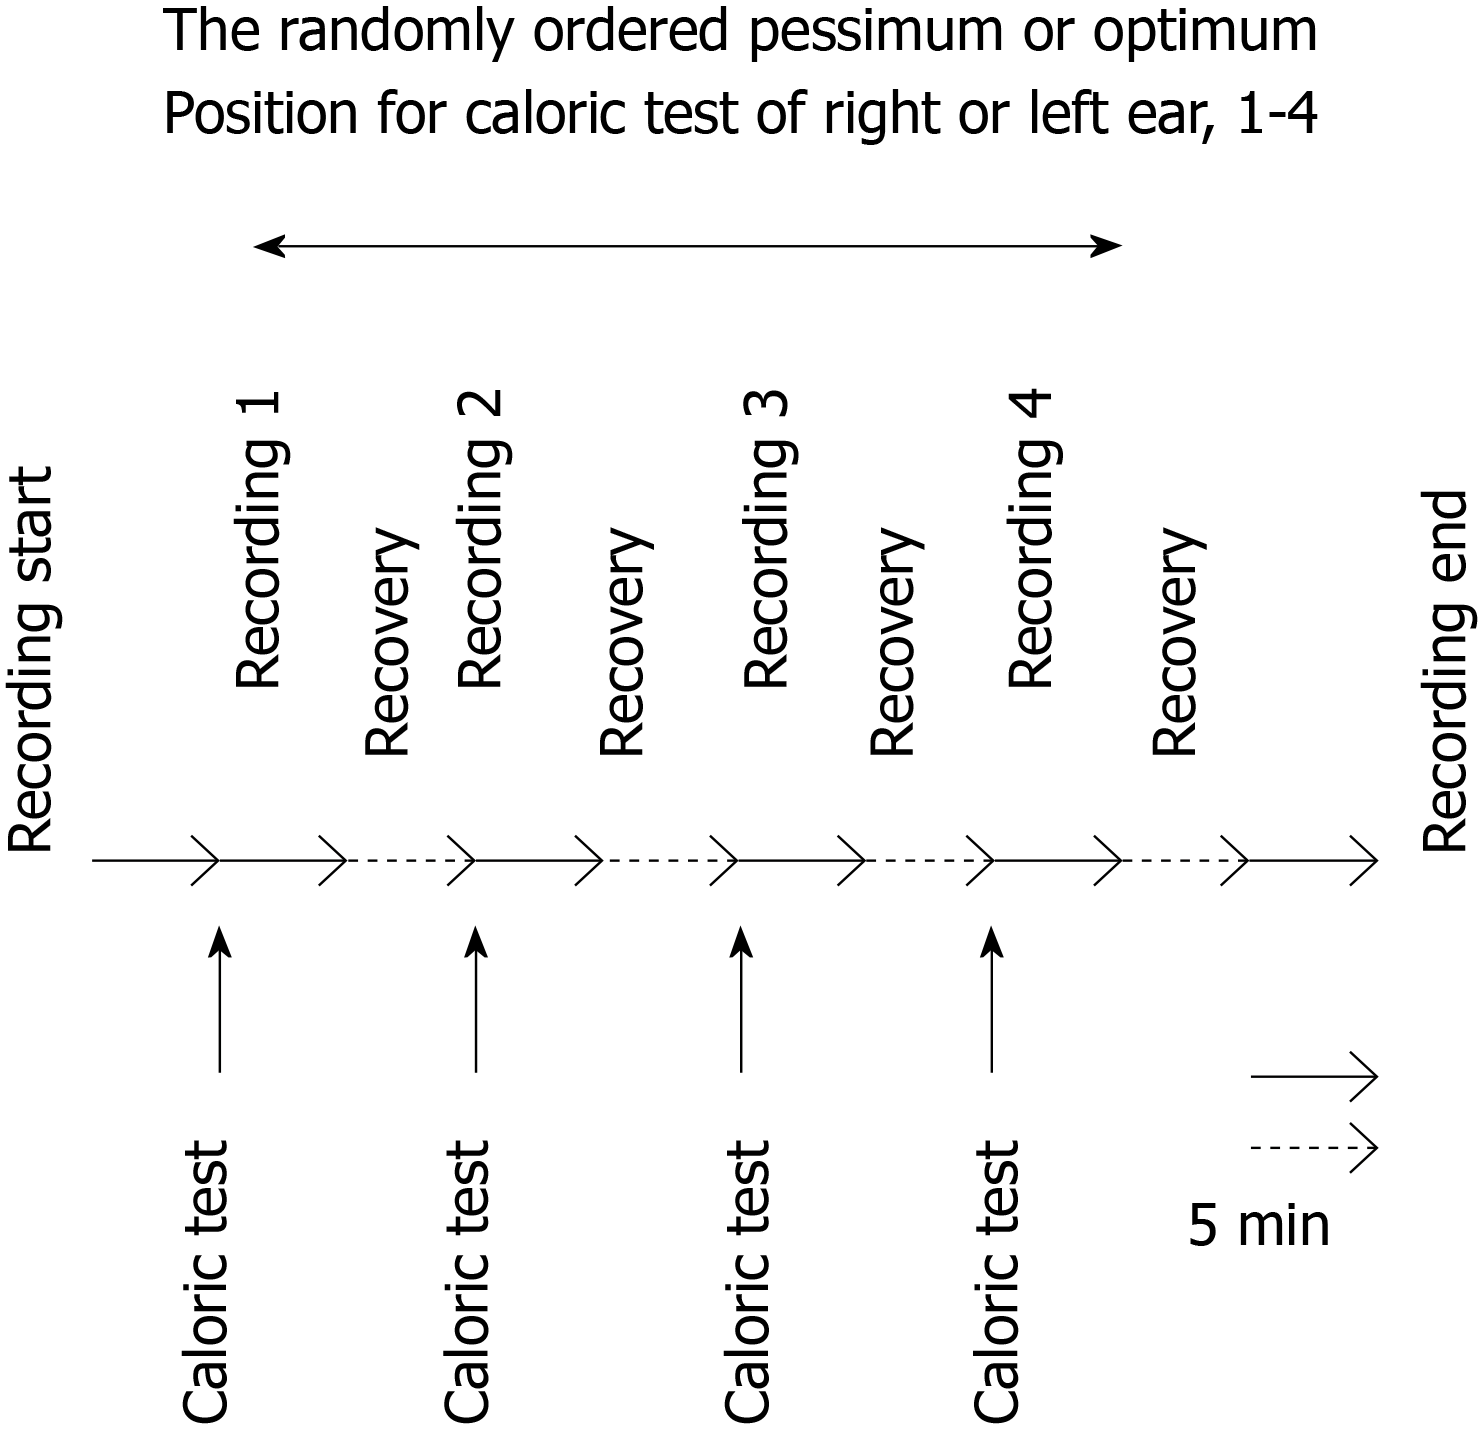
Figure 2 The study design and timeline.
Each horizontal arrow is equal to 5 min.
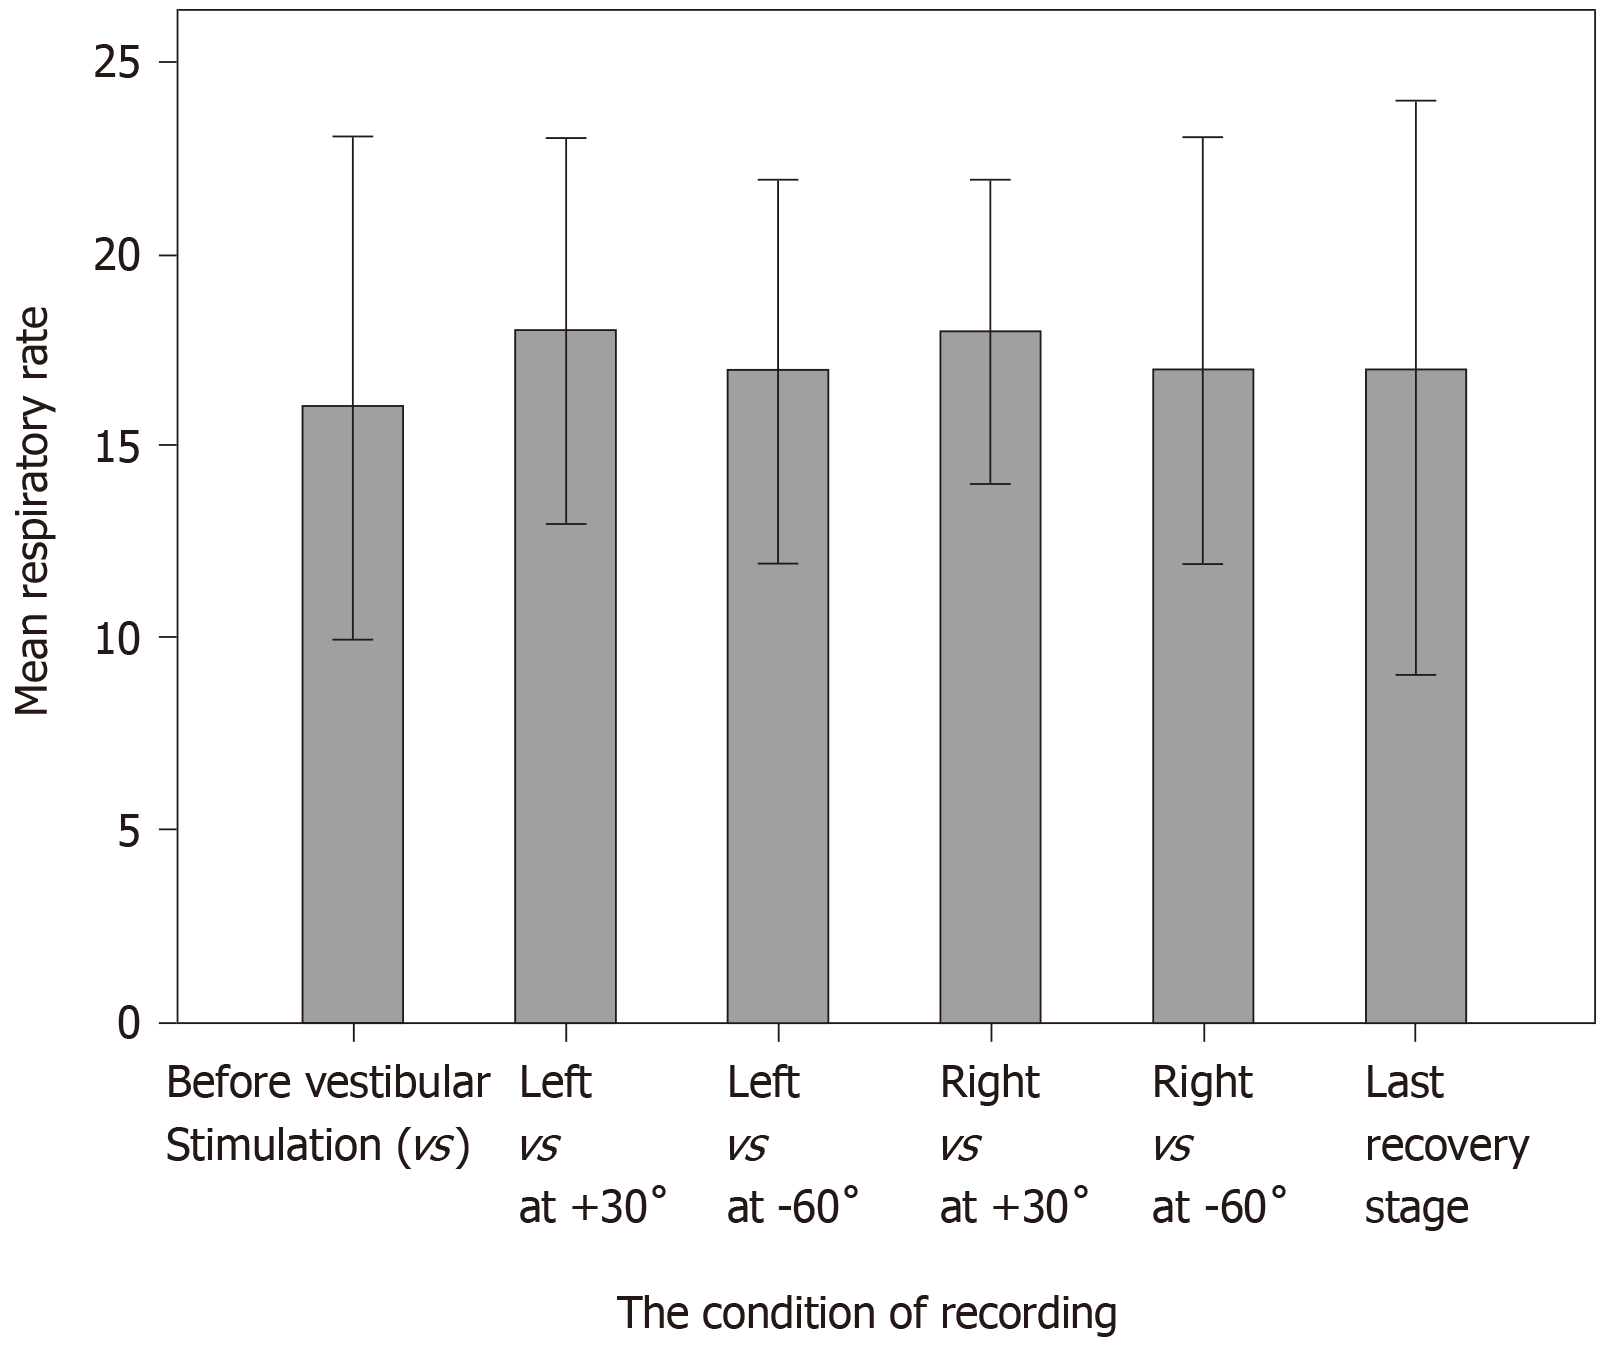
Figure 3 The mean ± SD of respiratory rate before vestibular stimulation, after it and following the last recovery stage (n = 12).
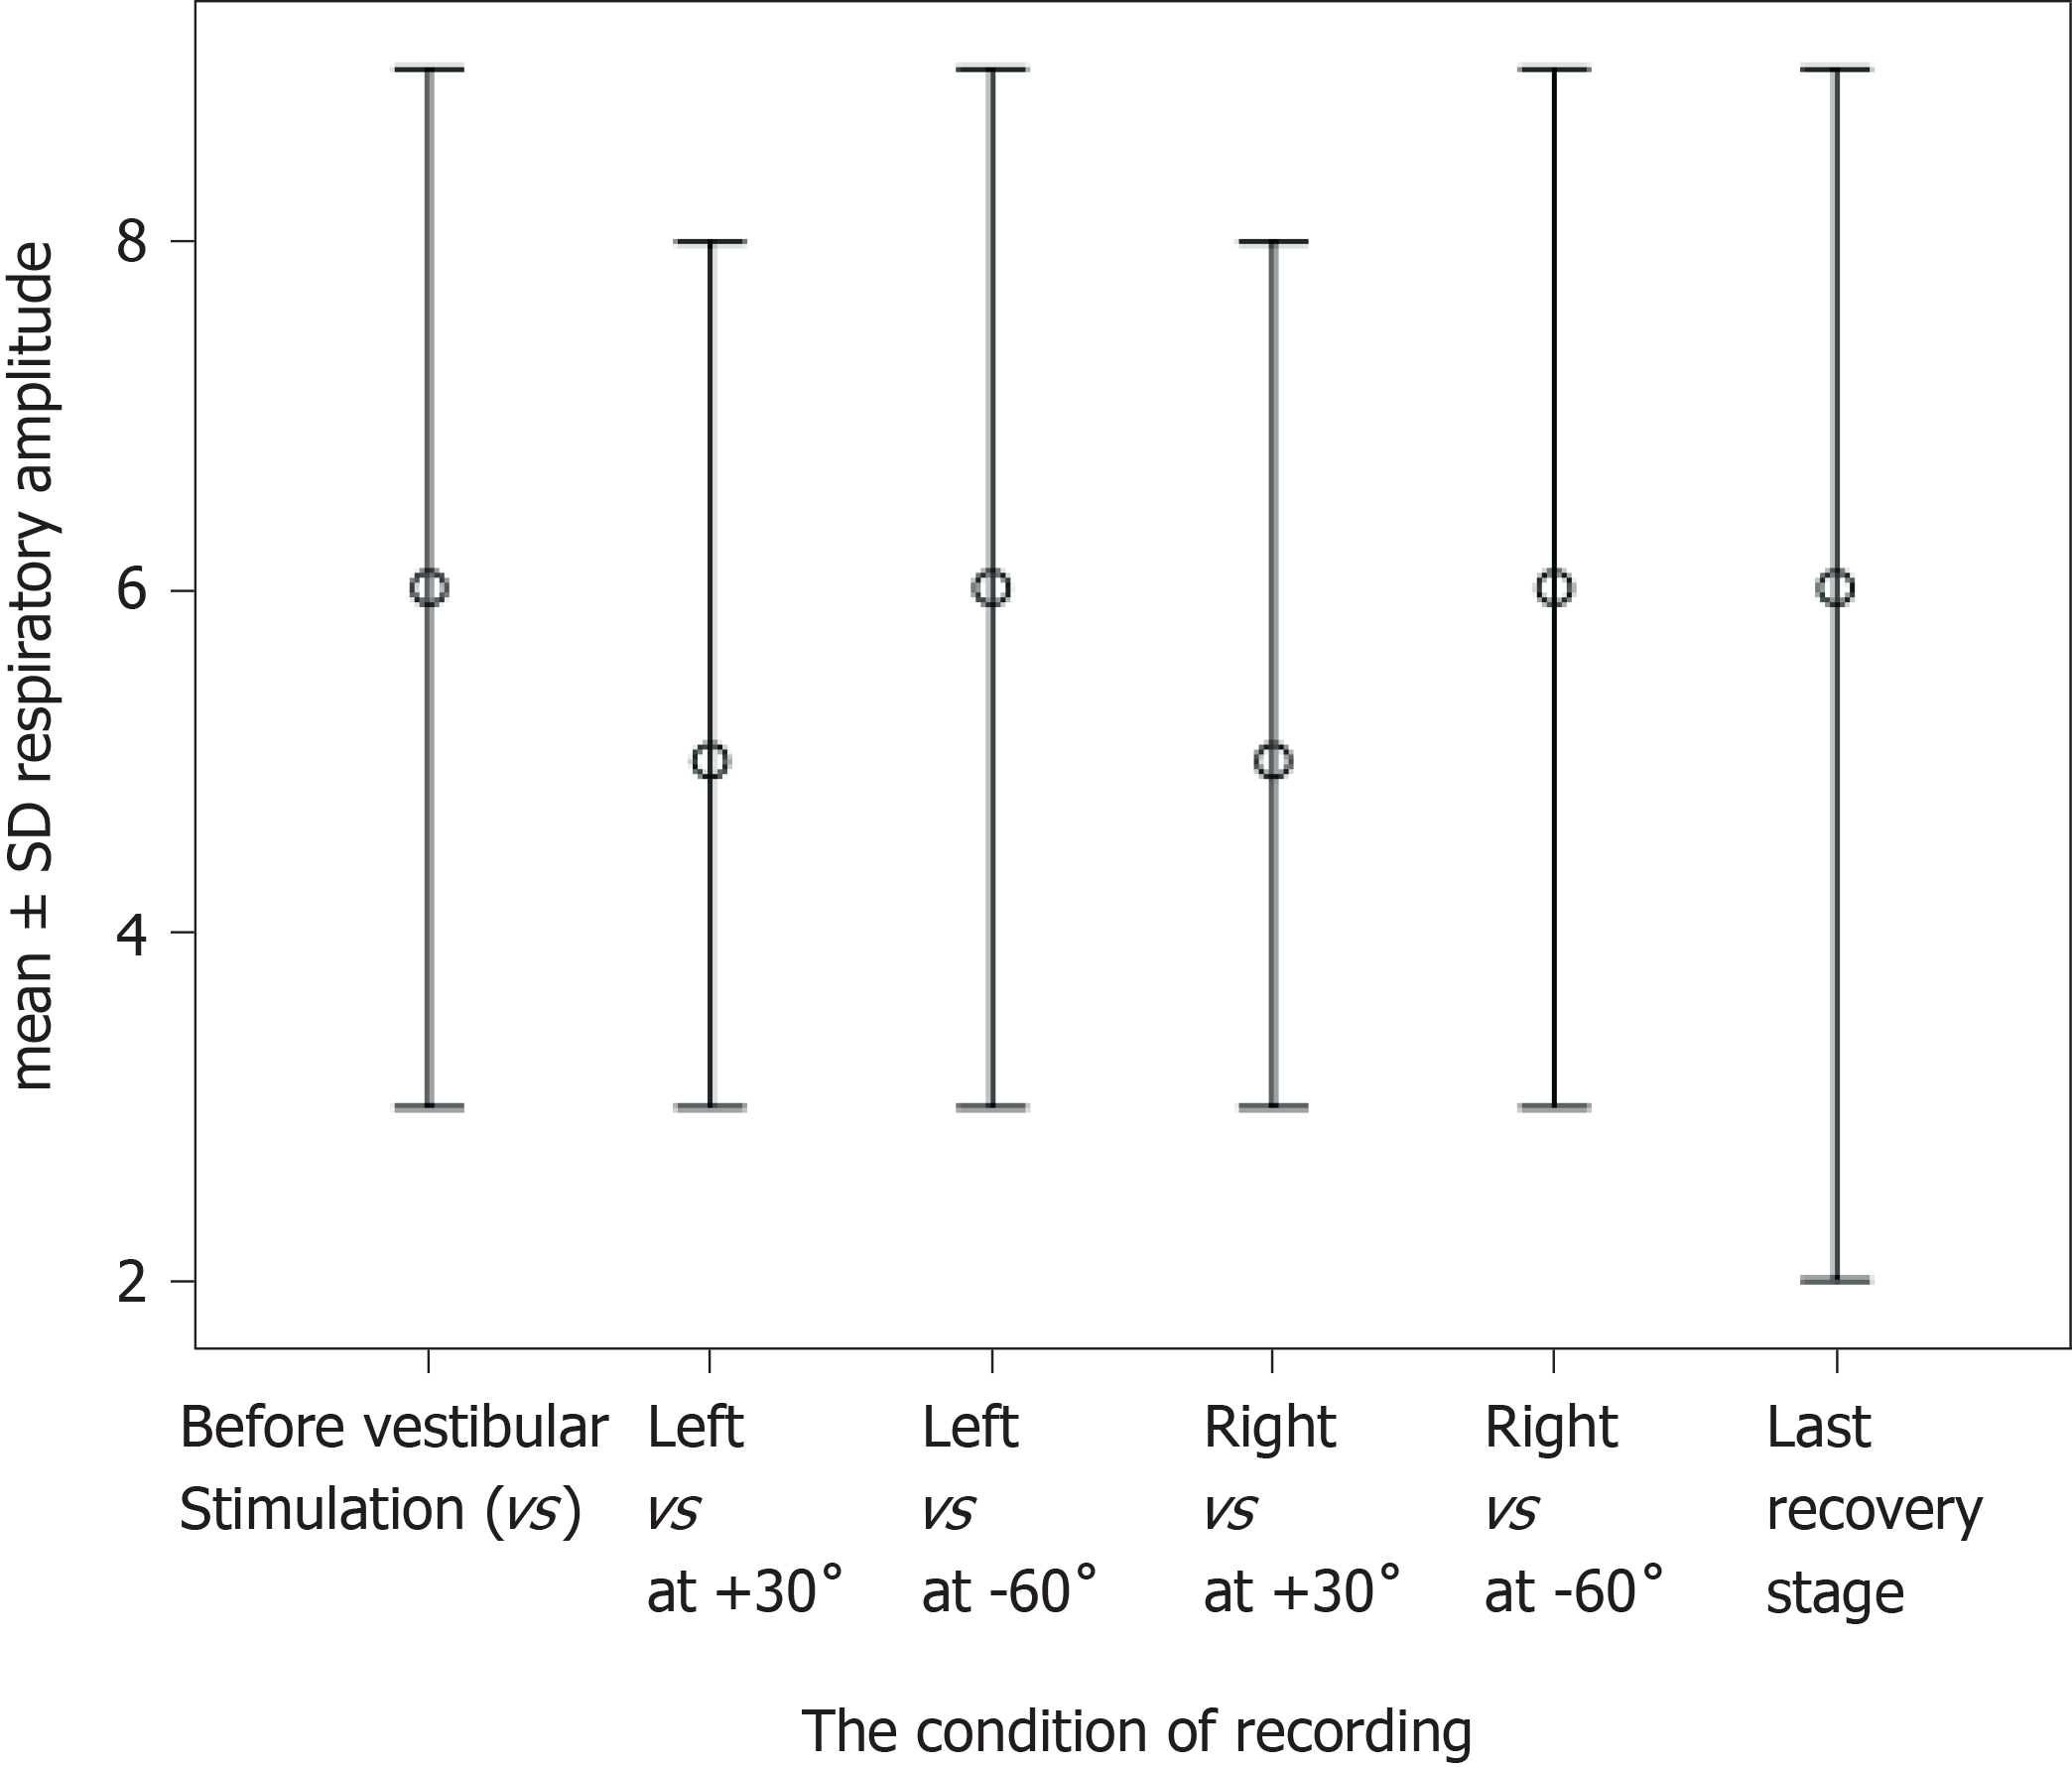
Figure 4 The mean ± SD of respiratory amplitude before vestibular stimulation, after it and following the last recovery stage (n = 12).
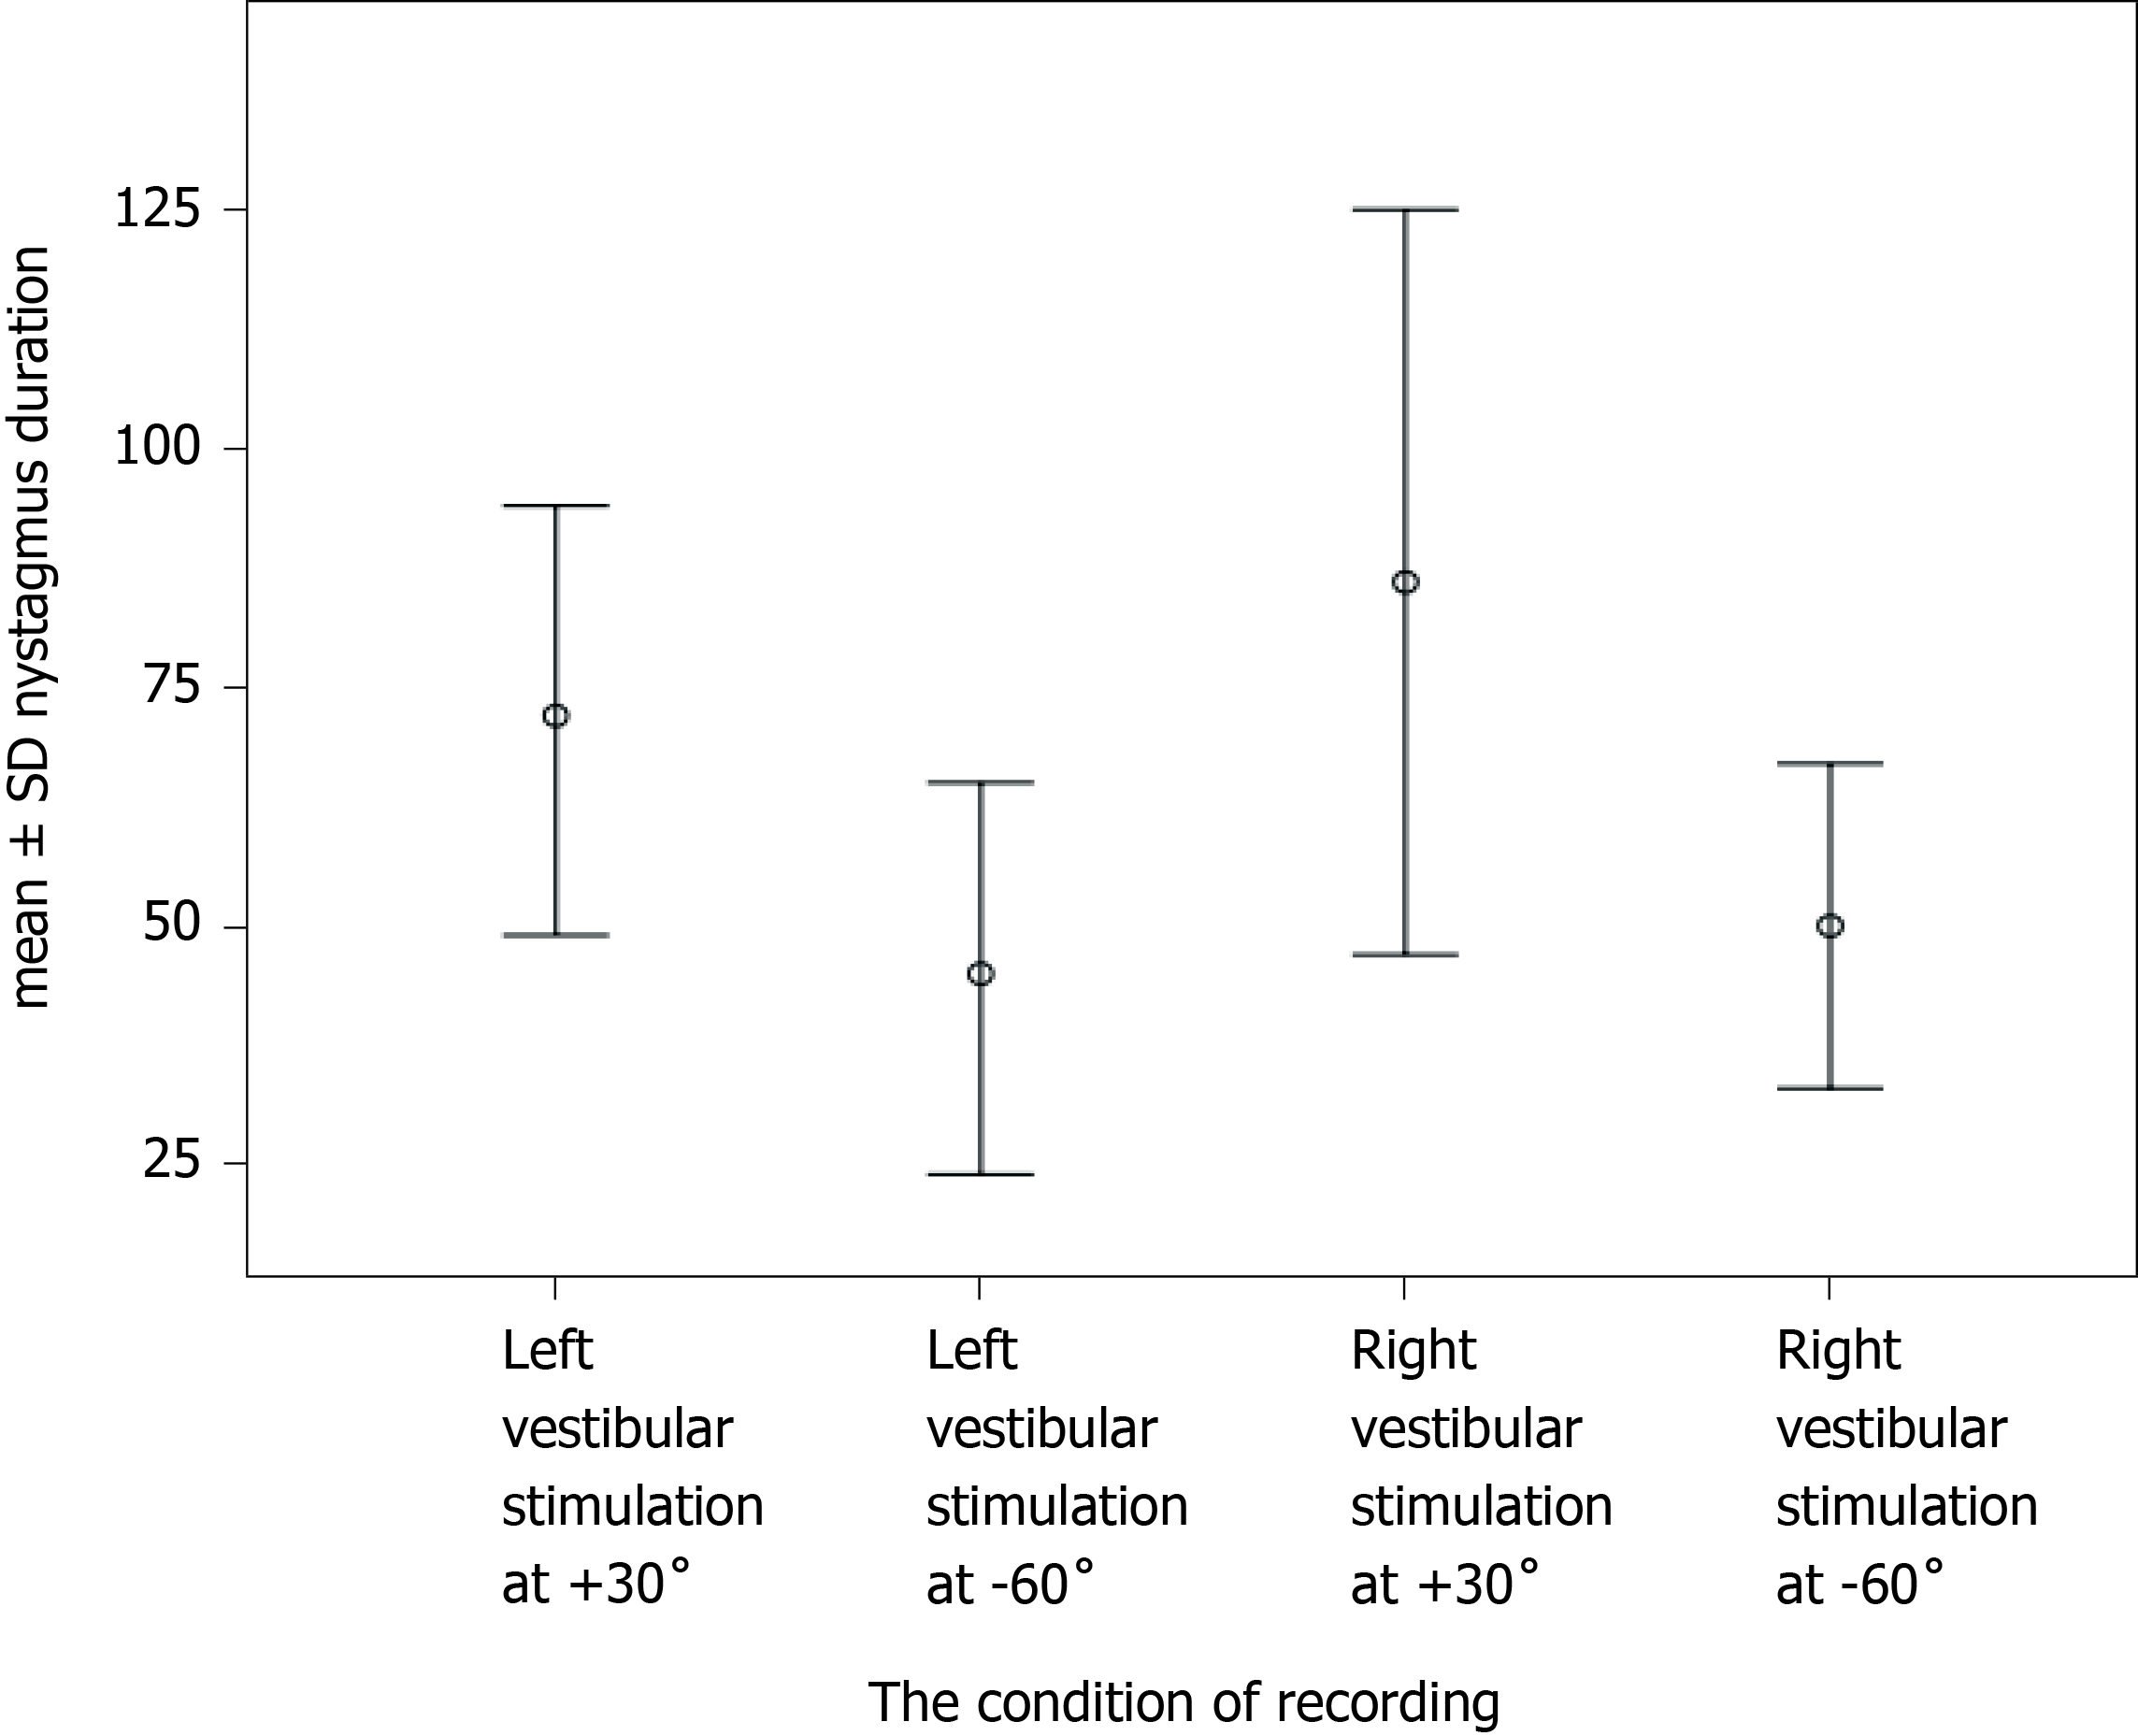
Figure 5 The mean ± SD of nystagmus duration in seconds after caloric vestibular stimulation of each ear in the optimum (+30º) and in the pessimum (+60º) conditions (n = 12).
- Citation: Aghababaei Ziarati M, Taziki MH, Hosseini SM. Autonomic laterality in caloric vestibular stimulation. World J Cardiol 2020; 12(4): 144-154
- URL: https://www.wjgnet.com/1949-8462/full/v12/i4/144.htm
- DOI: https://dx.doi.org/10.4330/wjc.v12.i4.144


