Copyright
©2014 Baishideng Publishing Group Inc.
World J Biol Chem. May 26, 2014; 5(2): 240-253
Published online May 26, 2014. doi: 10.4331/wjbc.v5.i2.240
Published online May 26, 2014. doi: 10.4331/wjbc.v5.i2.240
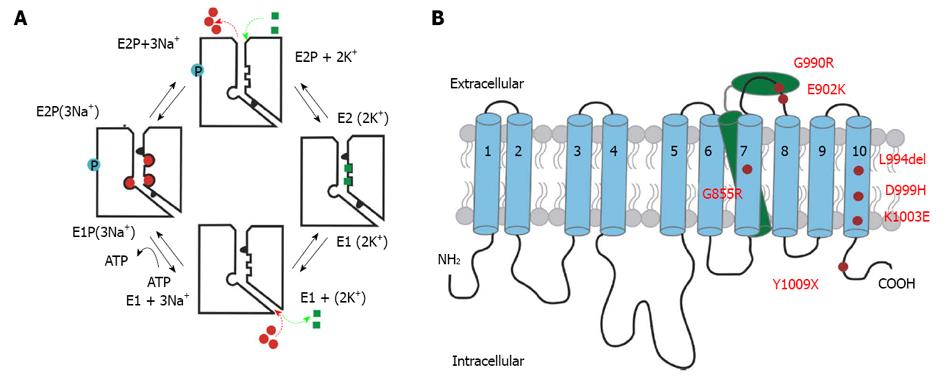
Figure 1 Reaction mechanism and structural detail of the Na+/K+-ATPase.
A: Schematic reaction cycle of one Na+/K+-ATPase pump molecule. The cytosolic side is shown at the bottom of each molecule depicted with an ion pathway to the right, whereas the extracellular side is set at the top. Na+ ions are shown as red circles, and K+ ion are shown as green squares. Blue circles depict the phosphorylated state; B: Simplified structure of the Na+/K+-ATPase indicating FHM2/SHM mutation positions studied in this work. The α-subunit is composed of ten transmembrane domains (blue). The N- and C-terminus are located intracellularly. The β-subunit comprises only one transmembrane domain (green) and a large ectodomain with several glycosylation sites. FHM2/SHM mutations are marked in red.
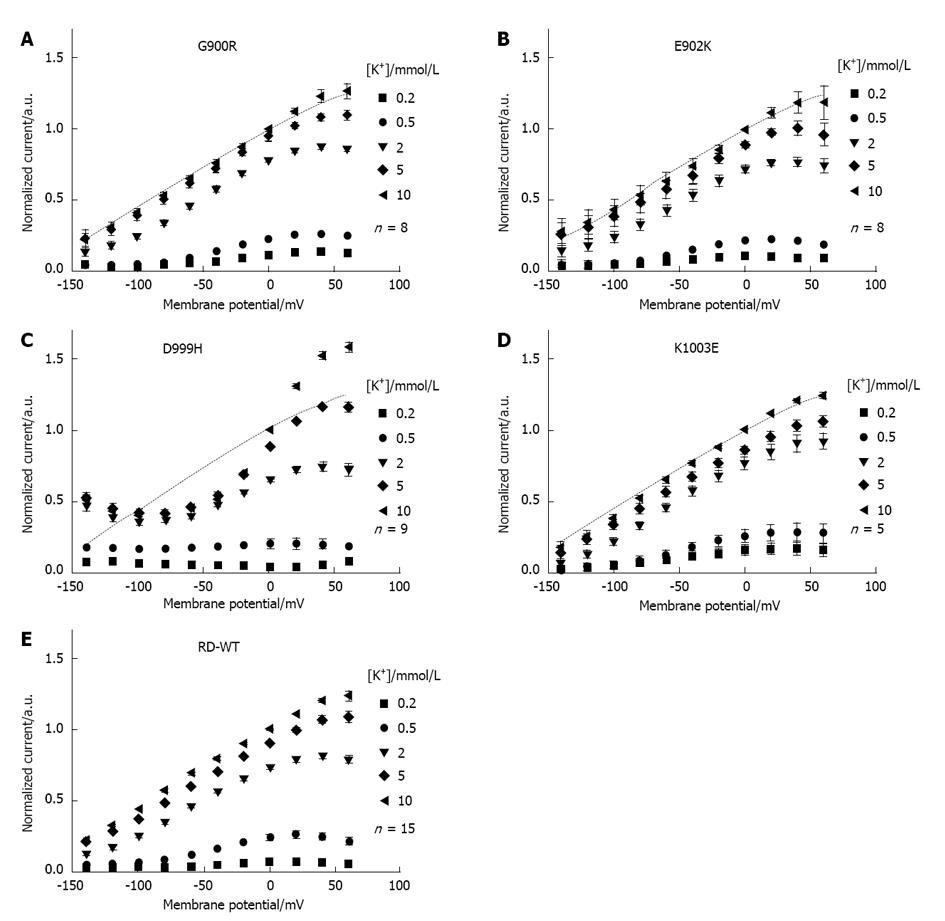
Figure 2 Voltage and [K+]ex dependence of stationary currents for ATP1A2 RD-WT, G900R, K902E, D999H and K1003E.
A-E: Dependence of K+-induced stationary currents of the RD-WT enzyme (E) and the mutants G900R (A), E902K (B), D999H (C) and K1003E (D) on the extracellular K+ concentration and on membrane potential. [K+]ex-dependent currents were calculated as the difference between currents induced by voltage steps first in presence of different [K+]ex and then at [K+]ex = 0. The amplitudes at [K+]ex = 10 mmol/L and 0 mV were used for normalization. Different [K+]ex are indicated by symbols. The RD-WT curve at 10 mmol/L K+ is superimposed as dotted line for comparison. Data are means ± SE obtained from 5-15 cells of at least three batches.
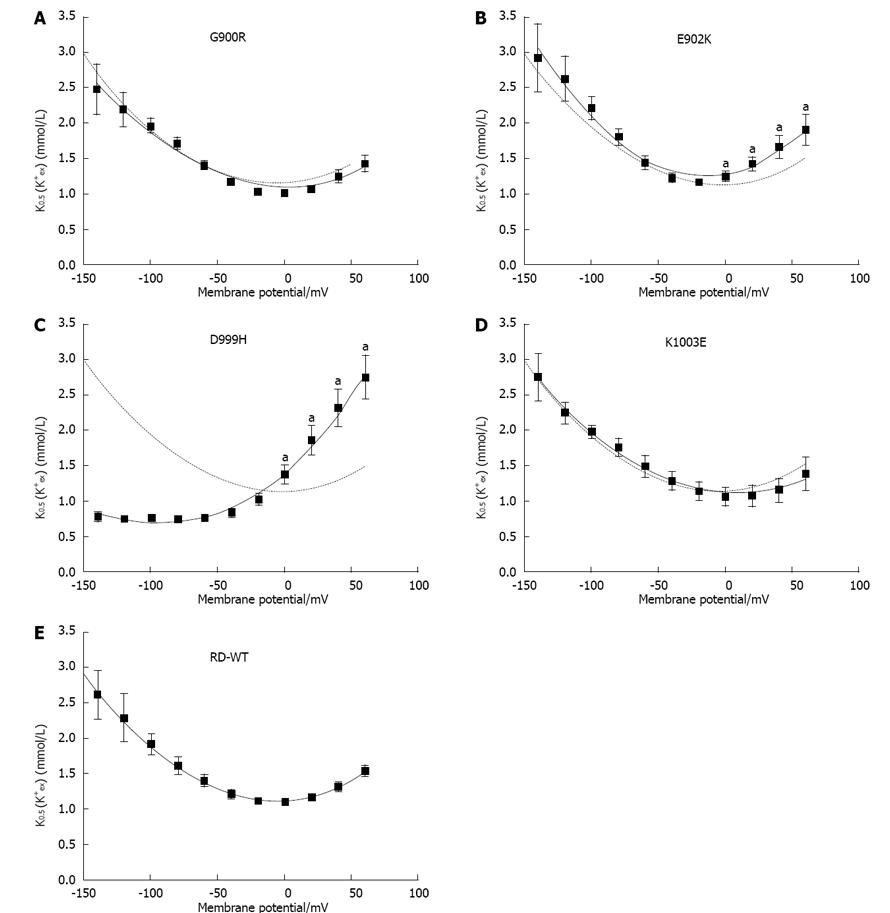
Figure 3 Apparent K+ affinity.
A-E: K0.5 values for the [K+]ex dependence of stationary currents at different membrane potentials for the RD-WT enzyme (E) and the mutants G900R (A), E902K (B), D999H (C) and K1003E (D), as calculated from fits of a Hill function to the data in Figure 2, respectively. Data were approximated with polynomial functions of second or third (D999H) grade to determine the minimum. The curve derived from RD-WT data is superimposed as dotted line for comparison. An “a” indicates that the data point was significantly different from the RD-WT data (aP < 0.05 vs RD-WT, Student’s t-test). Data are means ± SE obtained from 5-15 cells of at least three batches.
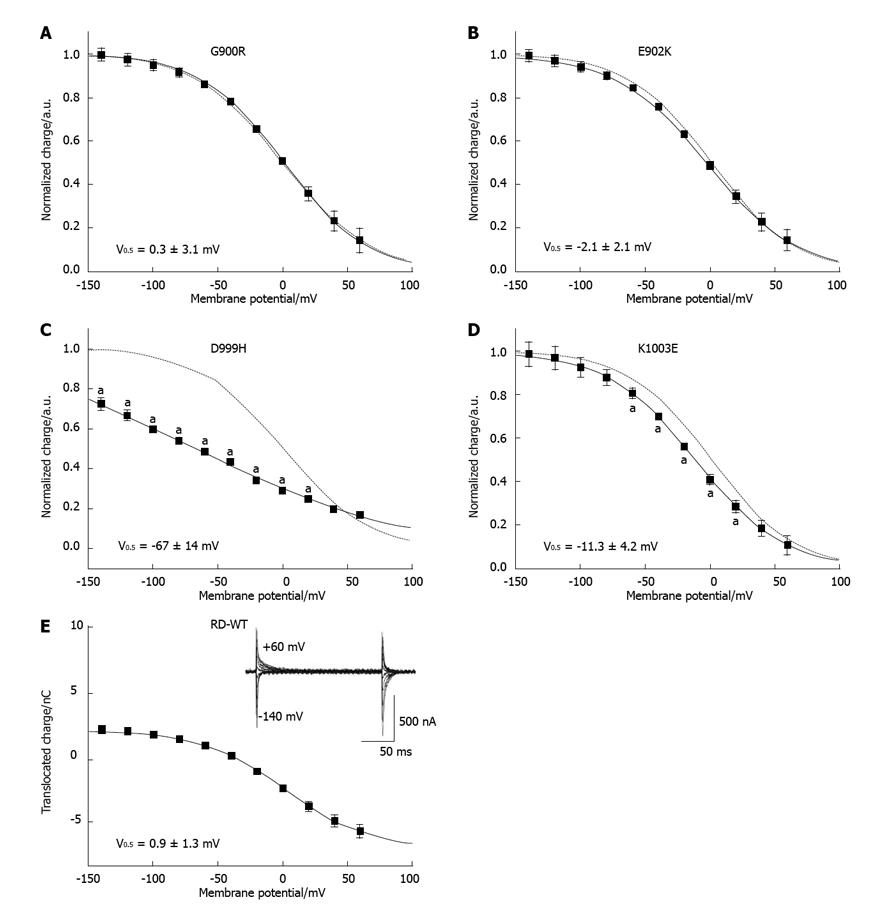
Figure 4 Voltage dependence of translocated transient charge.
A-E: Normalized Q(V) curves from ouabain-sensitive transient currents for the RD-WT enzyme (E), and for the mutants G900R (A), E902K (B), D999H (C) and K1003E (D). Fits of a Boltzmann function to the data are superimposed. Qmin and Qmax determined by the fit were used for normalization. The Boltzmann curve of the RD-WT enzyme is shown as a dotted line for comparison. Transient current signals are shown in a box for the RD-WT enzyme in panel (E). An “a” indicates that the data point was significantly different from the RD-WT data (aP < 0.05 vs RD-WT, Student’s t-test).
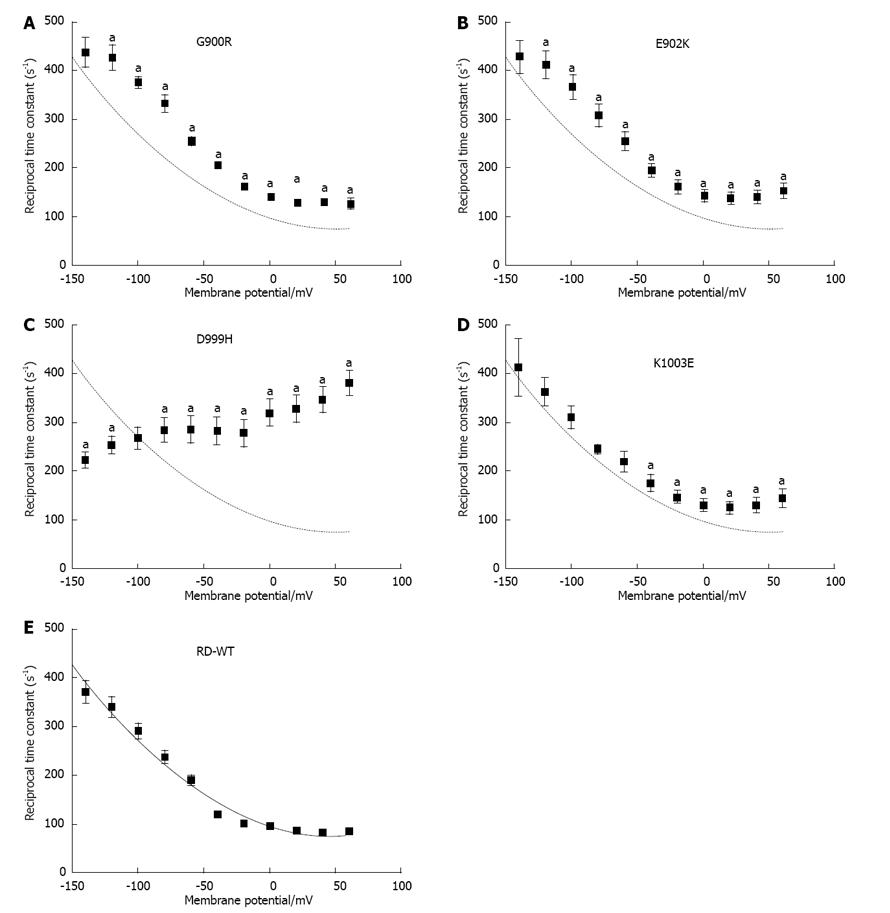
Figure 5 Reciprocal time constants of transient currents.
A-E: Voltage dependence of reciprocal time constants τ-1 from ouabain-sensitive transient currents of RD-WT enzyme (E) and the mutants G900R (A), E902K (B), D999H (C) and K1003E (D) under K+-free Na+/Na+ exchange conditions. The fit of a polynomial function to RD-WT values is superimposed as a dotted line. An “a” indicates that the data point was significantly different from the RD-WT data (aP < 0.05 vs RD-WT, Student’s t-test). Data are means ± SE from 5-21 oocytes of at least three batches.
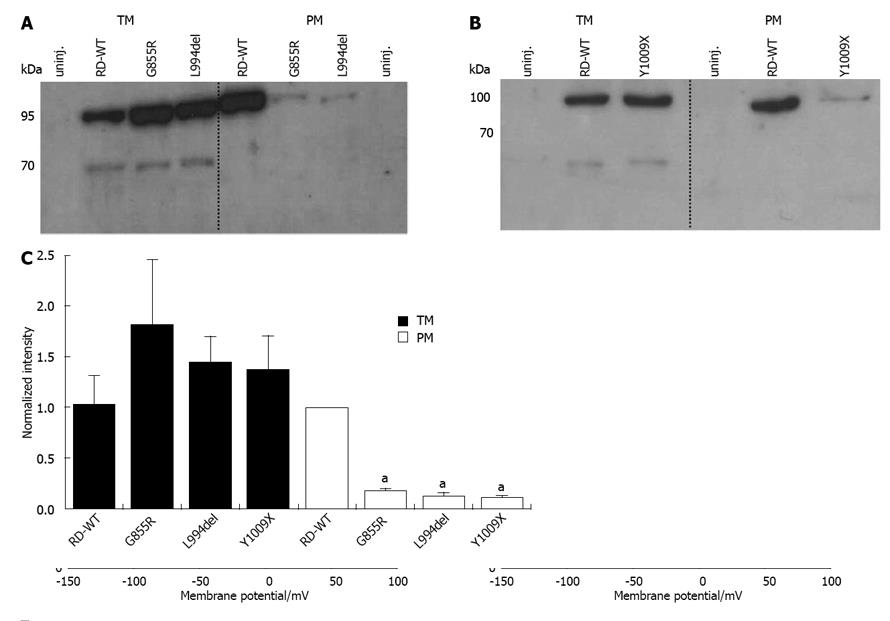
Figure 6 Protein expression of the constructs G855R, L994del and Y1009X.
A, B: Representative Western blots for the constructs G855R, L994del (A) and Y1009X (B) compared to the RD-WT enzyme and non-injected cells. Samples of total intracellular membrane (TM, left) and plasma membrane (PM, right) fractions corresponding to the protein amount of two oocytes were loaded in each lane (the number of cell equivalents serves as internal loading standard); C: Densitometric analysis of band intensities from at least four Western blots of G855R, L994del, Y1009X and RD-WT. The program ImageJ 1.44o (Wayne Rasband, United States) was used for analysis. In each experiment, signals were normalized to the intensity of the RD-WT signal from PM samples. An “a” indicates that the data point was significantly different from the RD-WT data (aP < 0.05 vs RD-WT, Student’s t-test). Data are means ± SD.
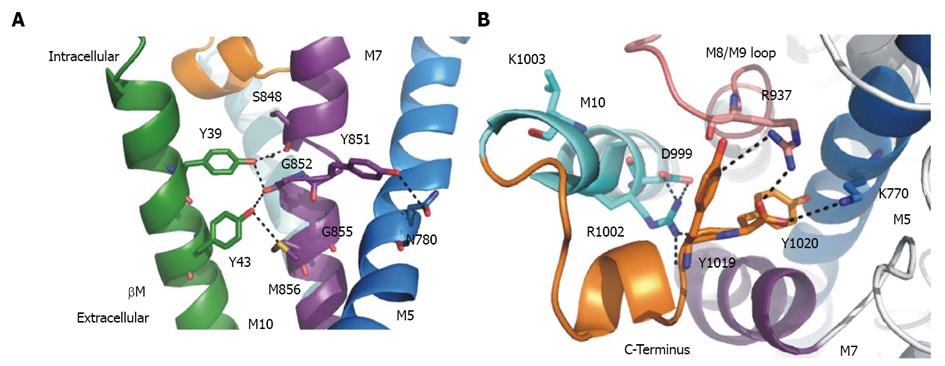
Figure 7 Structural details of the C-terminal region and α/β-interactions.
A: Structural details (PDB structure entry 3B8E) of putative interactions between the α- and β-subunit. Interacting residues are shown as sticks. Tyr39 and Tyr43 in the β-transmembrane domain (green) can interact with αM7 (purple). The α-helix is unwound at residue Gly952 (αM7). Tyr851 can form hydrogen bonds to Asn780 in αM5 (marine), which is part of the K+ binding site I and II. Also shown is αM10 (light blue) with the C-terminus (orange) of the α-subunit; B: Structural details of the C-terminal region viewed from the intracellular side. Possibly interacting residues are shown in sticks. The C-terminal Tyr1019 and Tyr1020 (orange) can interact with Arg1002 in αM10 (light blue), Arg937 (αM8/M9-loop in purple) and Lys770 in αM5 (marine). Asp999 (αM10) can form hydrogen bonds to Arg1002. Lys1003 (αM10) is not involved in the C-terminal network.
- Citation: Spiller S, Friedrich T. Functional analysis of human Na+/K+-ATPase familial or sporadic hemiplegic migraine mutations expressed in Xenopus oocytes. World J Biol Chem 2014; 5(2): 240-253
- URL: https://www.wjgnet.com/1949-8454/full/v5/i2/240.htm
- DOI: https://dx.doi.org/10.4331/wjbc.v5.i2.240


