Copyright
©2013 Baishideng Publishing Group Co.
World J Gastrointest Surg. Dec 27, 2013; 5(12): 321-328
Published online Dec 27, 2013. doi: 10.4240/wjgs.v5.i12.321
Published online Dec 27, 2013. doi: 10.4240/wjgs.v5.i12.321
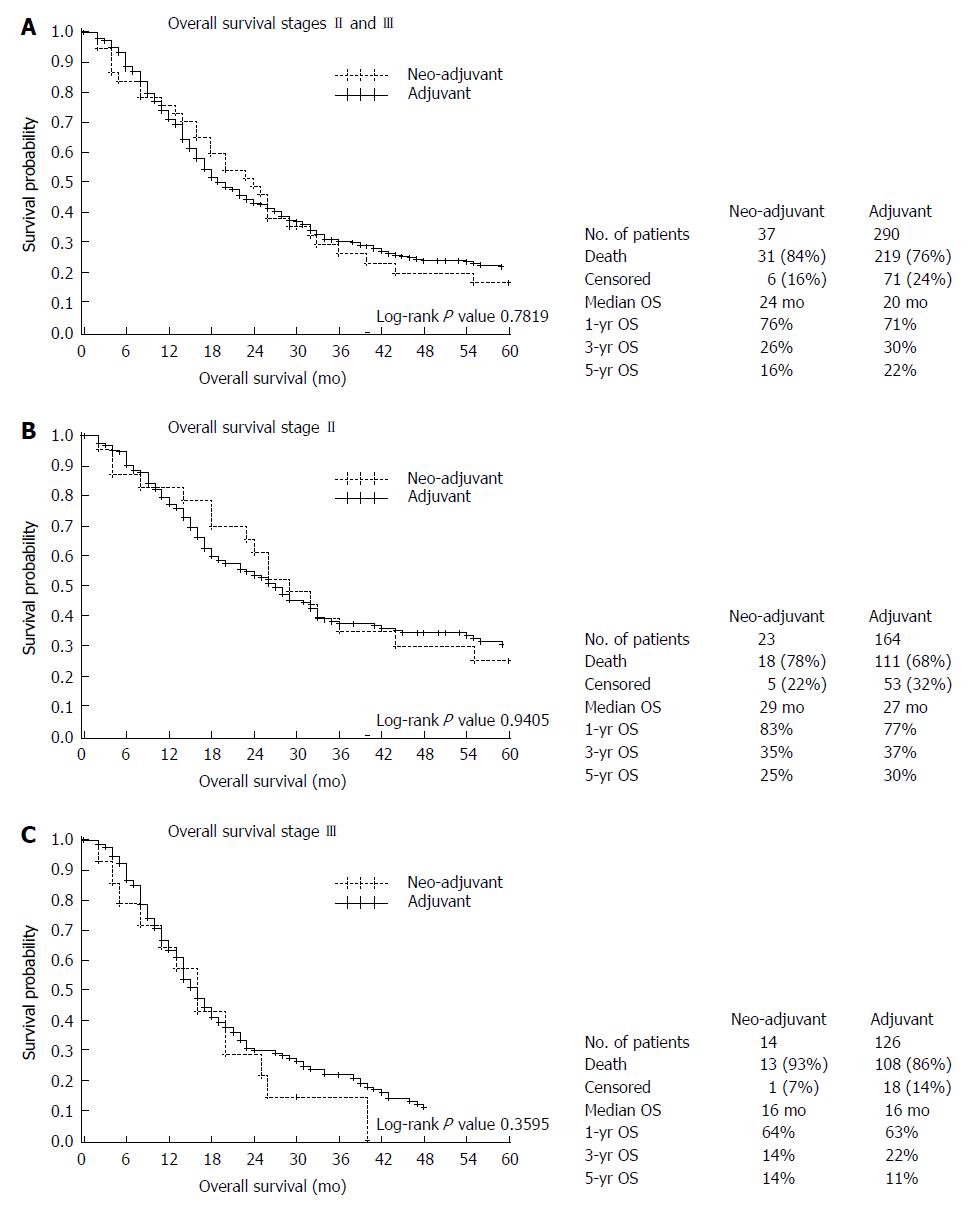
Figure 1 Comparison of Kaplan-Meier survival curves.
A: For Stage II and III gastric cancer patients who underwent preoperative chemotherapy compared to those who had postoperative chemotherapy (MS 24 mo vs 20 mo, respectively; P = 0.7819); B: Stage II gastric cancer patients who underwent neoadjuvant chemotherapy (with or without adjuvant therapy) compared to those who had adjuvant chemotherapy alone (MS 29 mo vs 27 mo, respectively; 5-yr operating system (OS) 25% vs 30%; P = 0.9405); C: Stage III gastric cancer patients who underwent neoadjuvant chemotherapy (with or without adjuvant therapy) compared to those who had adjuvant chemotherapy alone (MS 16 mo vs 16 mo, respectively; 5-yr OS 14% vs 11%; P = 0.3595).
- Citation: Arrington AK, Nelson R, Patel SS, Luu C, Ko M, Garcia-Aguilar J, Kim J. Timing of chemotherapy and survival in patients with resectable gastric adenocarcinoma. World J Gastrointest Surg 2013; 5(12): 321-328
- URL: https://www.wjgnet.com/1948-9366/full/v5/i12/321.htm
- DOI: https://dx.doi.org/10.4240/wjgs.v5.i12.321


