
















Copyright: ©Author(s) 2026.
World J Gastrointest Surg. Sep 27, 2026; 18(9): 119675
Published online Sep 27, 2026. doi: 10.4240/wjgs.119675
Published online Sep 27, 2026. doi: 10.4240/wjgs.119675
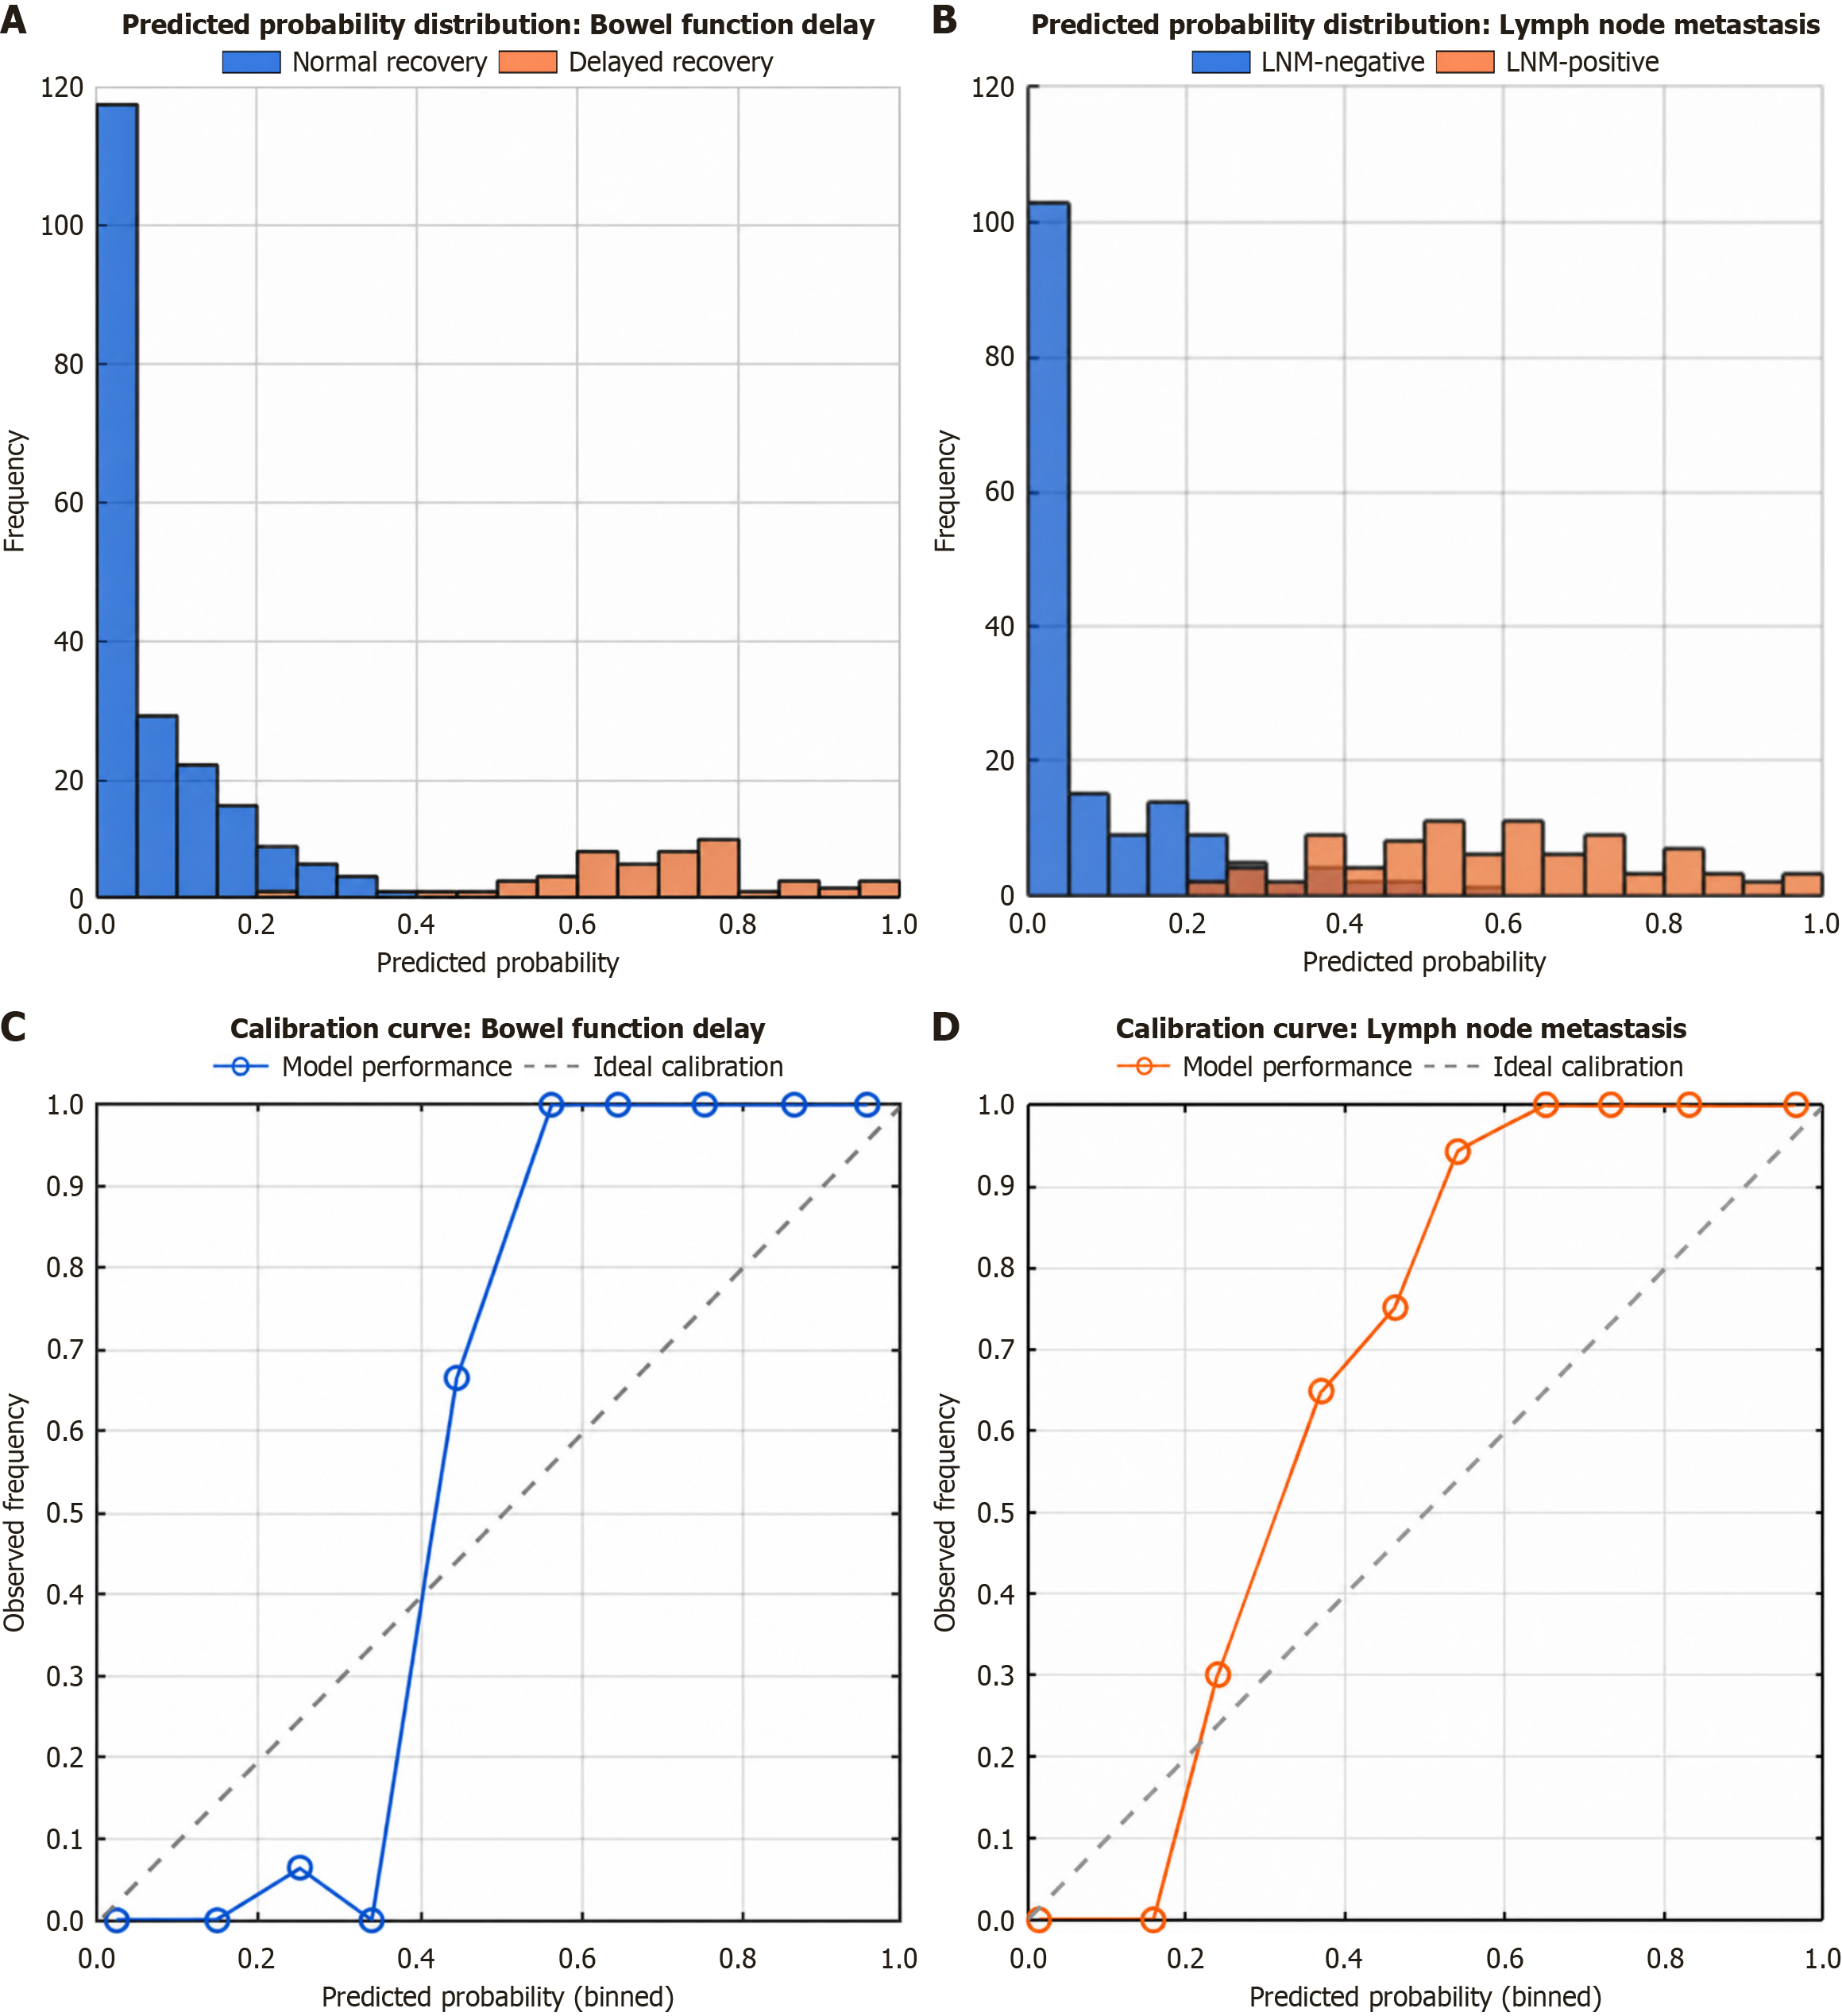
Figure 3 Performance of the multivariate logistic regression prediction models.
The P values from the Hosmer-Lemeshow test were greater than 0.05, indicating good model calibration for both outcomes. The area under the curve was 0.82 for the intestinal function model and 0.79 for the lymph node metastasis model. Calibration plots showing agreement between the predicted probabilities and actual observed outcomes. The dotted line represents the ideal fit (Figure 3C and D). Evaluation of models for predicting (Figure 3A and C) delayed intestinal function recovery and (Figure 3B and D) lymph node metastasis. A: Predicted probability distribution: Bowel function delay; B: Predicted probability distribution: Lymph node metastasis; C: Calibration curve: Bowel function delay; D: Calibration curve: Lymph node metastasis.
- Citation: Qiang JH, Cheng J, Meng F, Zhang SQ. Application of multivariate logistic regression in predicting postoperative intestinal function recovery and lymph node metastasis in colorectal cancer. World J Gastrointest Surg 2026; 18(9): 119675
- URL: https://www.wjgnet.com/1948-9366/full/v18/i9/119675.htm
- DOI: https://dx.doi.org/10.4240/wjgs.119675