Copyright
©The Author(s) 2025.
World J Gastrointest Surg. May 27, 2025; 17(5): 106000
Published online May 27, 2025. doi: 10.4240/wjgs.v17.i5.106000
Published online May 27, 2025. doi: 10.4240/wjgs.v17.i5.106000
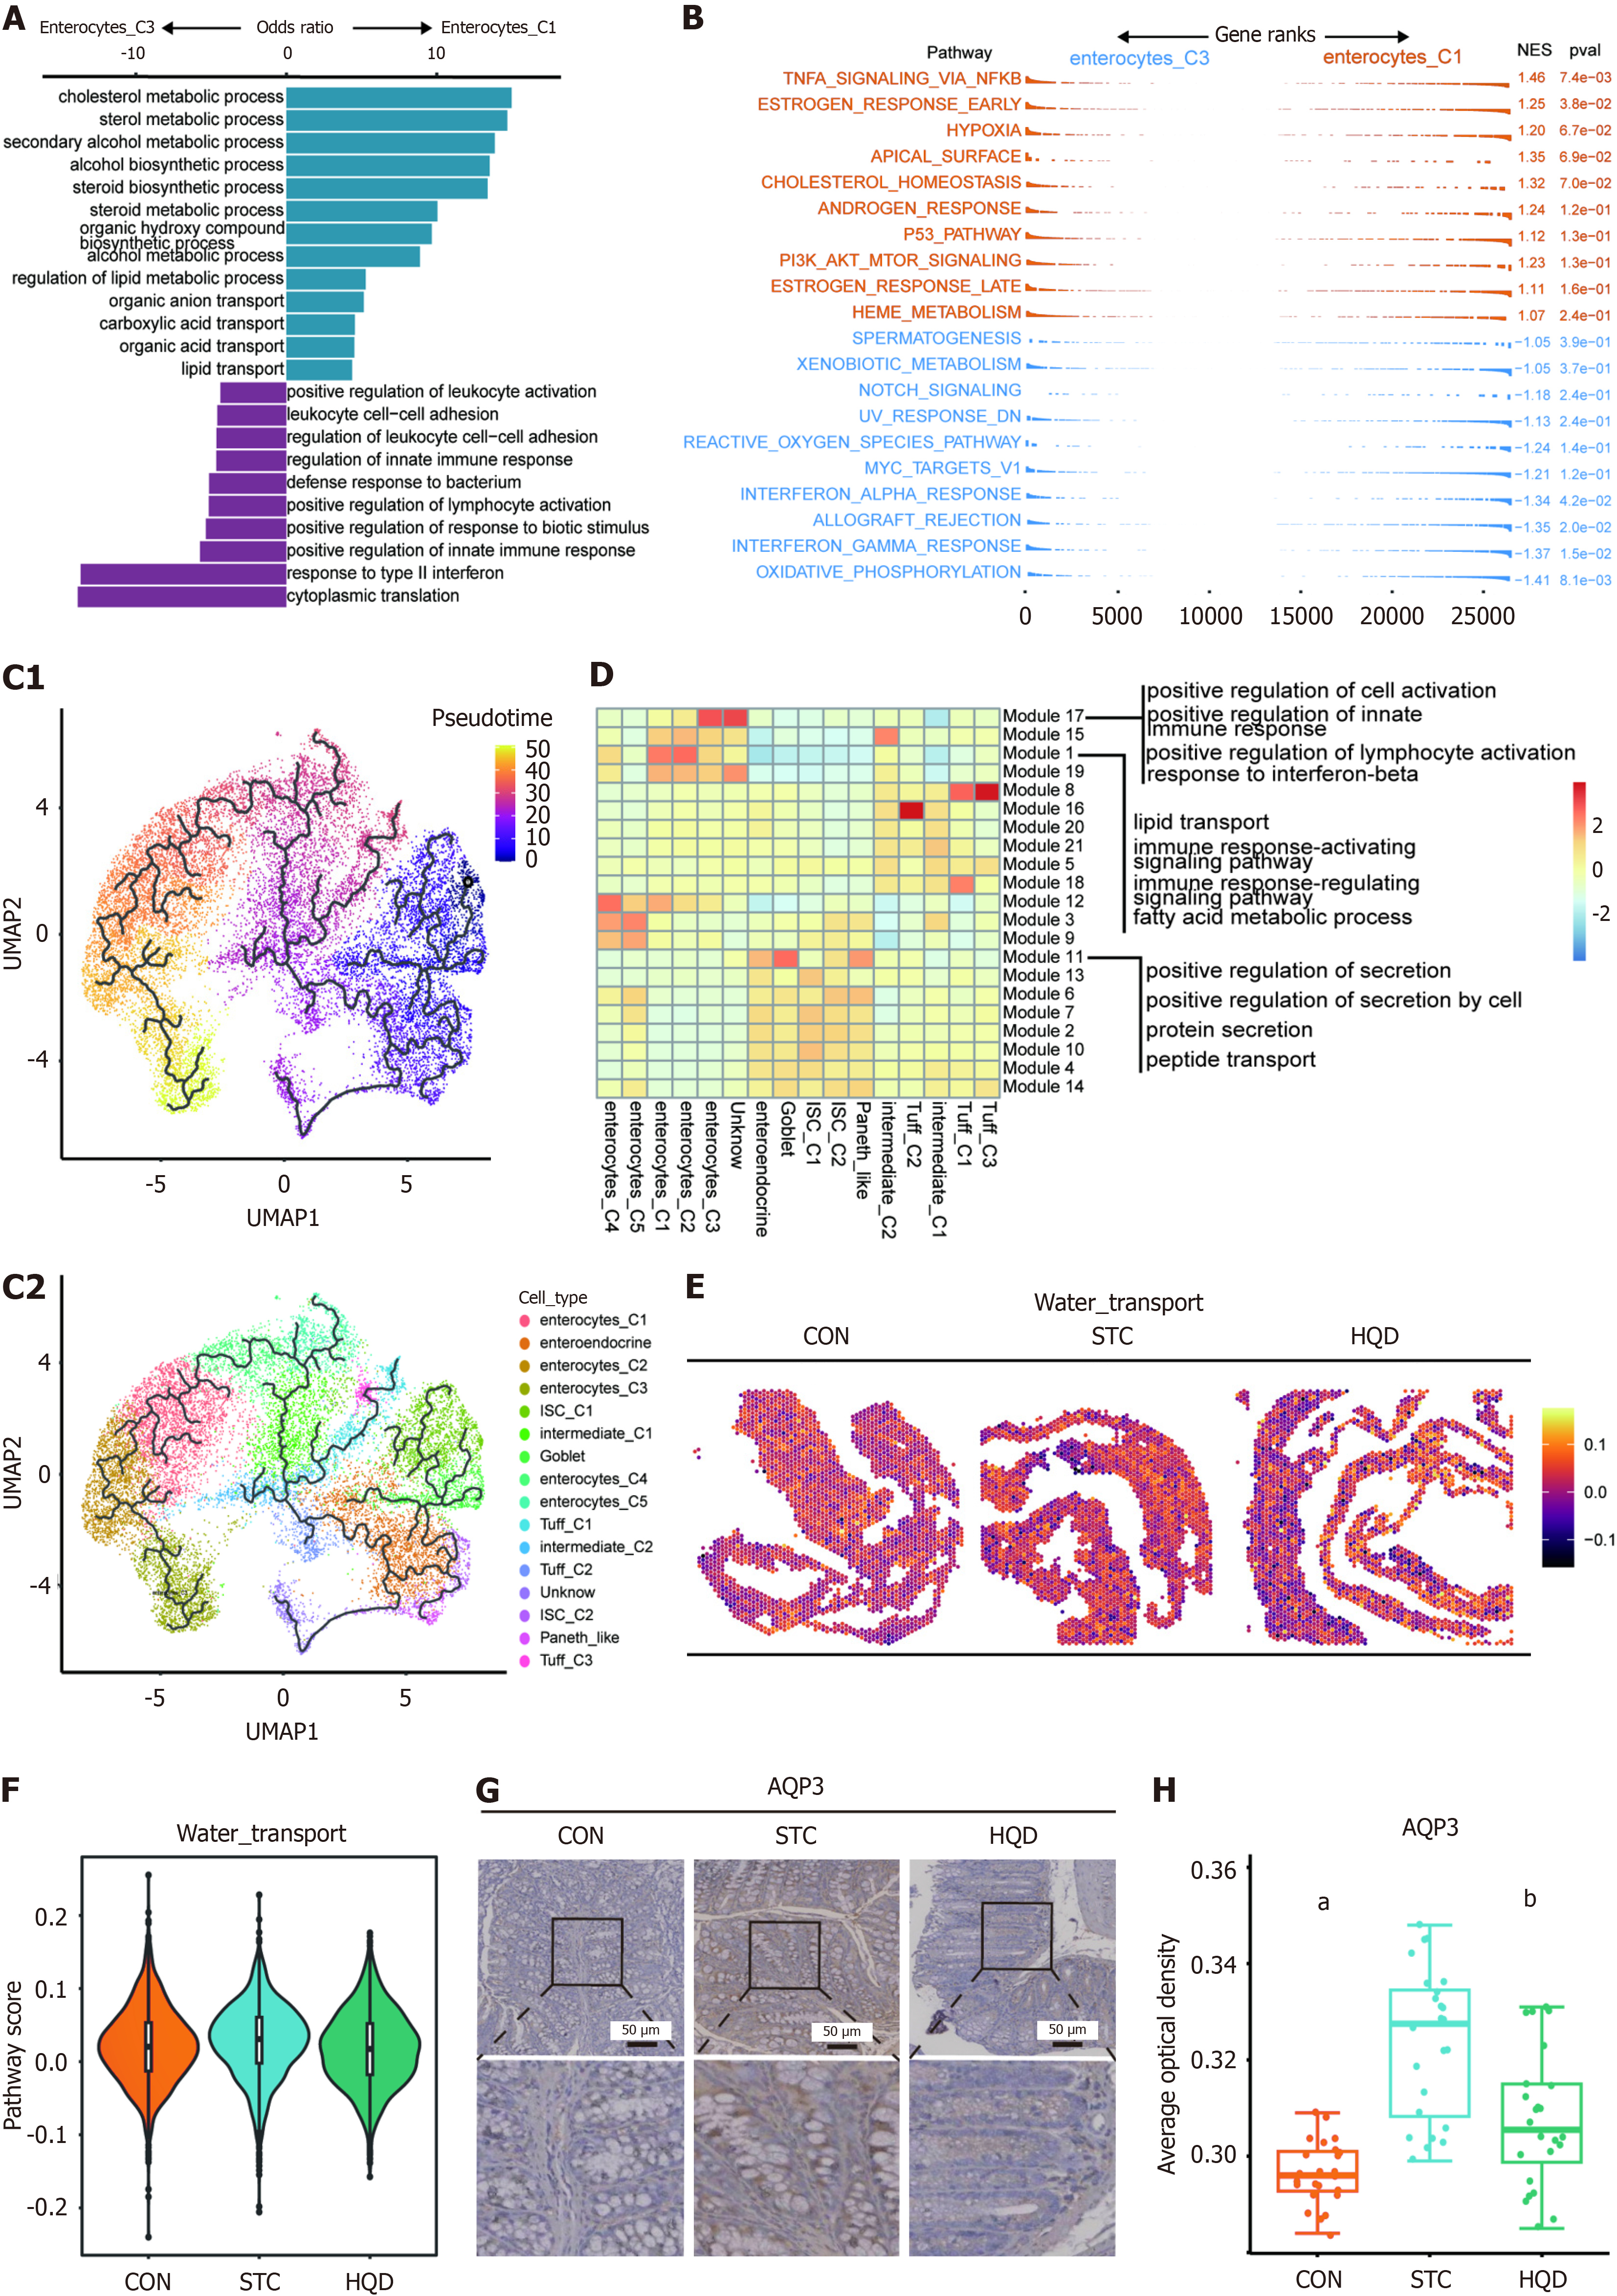
Figure 6 Functional Heterogeneity of Enterocyte_C1 and Enterocyte_C3.
A: Gene ontology enrichment in Enterocyte_C1 cells and Enterocyte_C3 cells. Odds ratio = gene ratio/background ratio; B: Gene set enrichment analysis enrichment for gene sets comparing Enterocyte_C1 vs Enterocyte_C3; C: Pseudotime reconstruction and developmental trajectory of epithelial cells inferred by Monocle 3 cells are colored by pseudotime (top). Cells are colored by epithelial subtype (bottom); D: Heatmap shows the expression of gene modules from Monocle 3; E: Spatial expression of the water transport pathway in epithelial cell regions of a control (CON) sample (left), an slow transit constipation (STC) sample (middle), and an Huangqi decoction (HQD) sample (right); F: Violin plots showing the water transport pathway score in all epithelial cells’ regions from three spatial transcriptome sequencing samples; G: Representative images of the immunohistochemical expression levels of aquaporin 3 in the colonic mucosa of mice from the CON, STC, and HQD groups were shown. The black scale bar represents 50 μm; H: Comparison of the average optical density of aquaporin 3 in mice between the CON, STC, and HQD groups. aP < 0.001, STC vs CON; bP < 0.05, STC vs HQD. NES: Normalize enrichment score; UMAP: Uniform manifold approximation and projection; ISC: Intestinal stem cell; CON: Control group; STC: Group of slow transit constipation model; HQD: Groups of treatment of Huangqi decoction; AQP3: Aquaporin 3.
- Citation: Chen HX, Xiao GZ, Yang CX, Zheng YH, Lei MY, Xu H, Ren DL, Huang L, He QL, Lin HC. Huangqi decoction ameliorated intestinal barrier dysfunction via regulating NF-κB signaling pathway in slow transit constipation model mice. World J Gastrointest Surg 2025; 17(5): 106000
- URL: https://www.wjgnet.com/1948-9366/full/v17/i5/106000.htm
- DOI: https://dx.doi.org/10.4240/wjgs.v17.i5.106000


