Copyright
©The Author(s) 2025.
World J Gastrointest Surg. May 27, 2025; 17(5): 106000
Published online May 27, 2025. doi: 10.4240/wjgs.v17.i5.106000
Published online May 27, 2025. doi: 10.4240/wjgs.v17.i5.106000
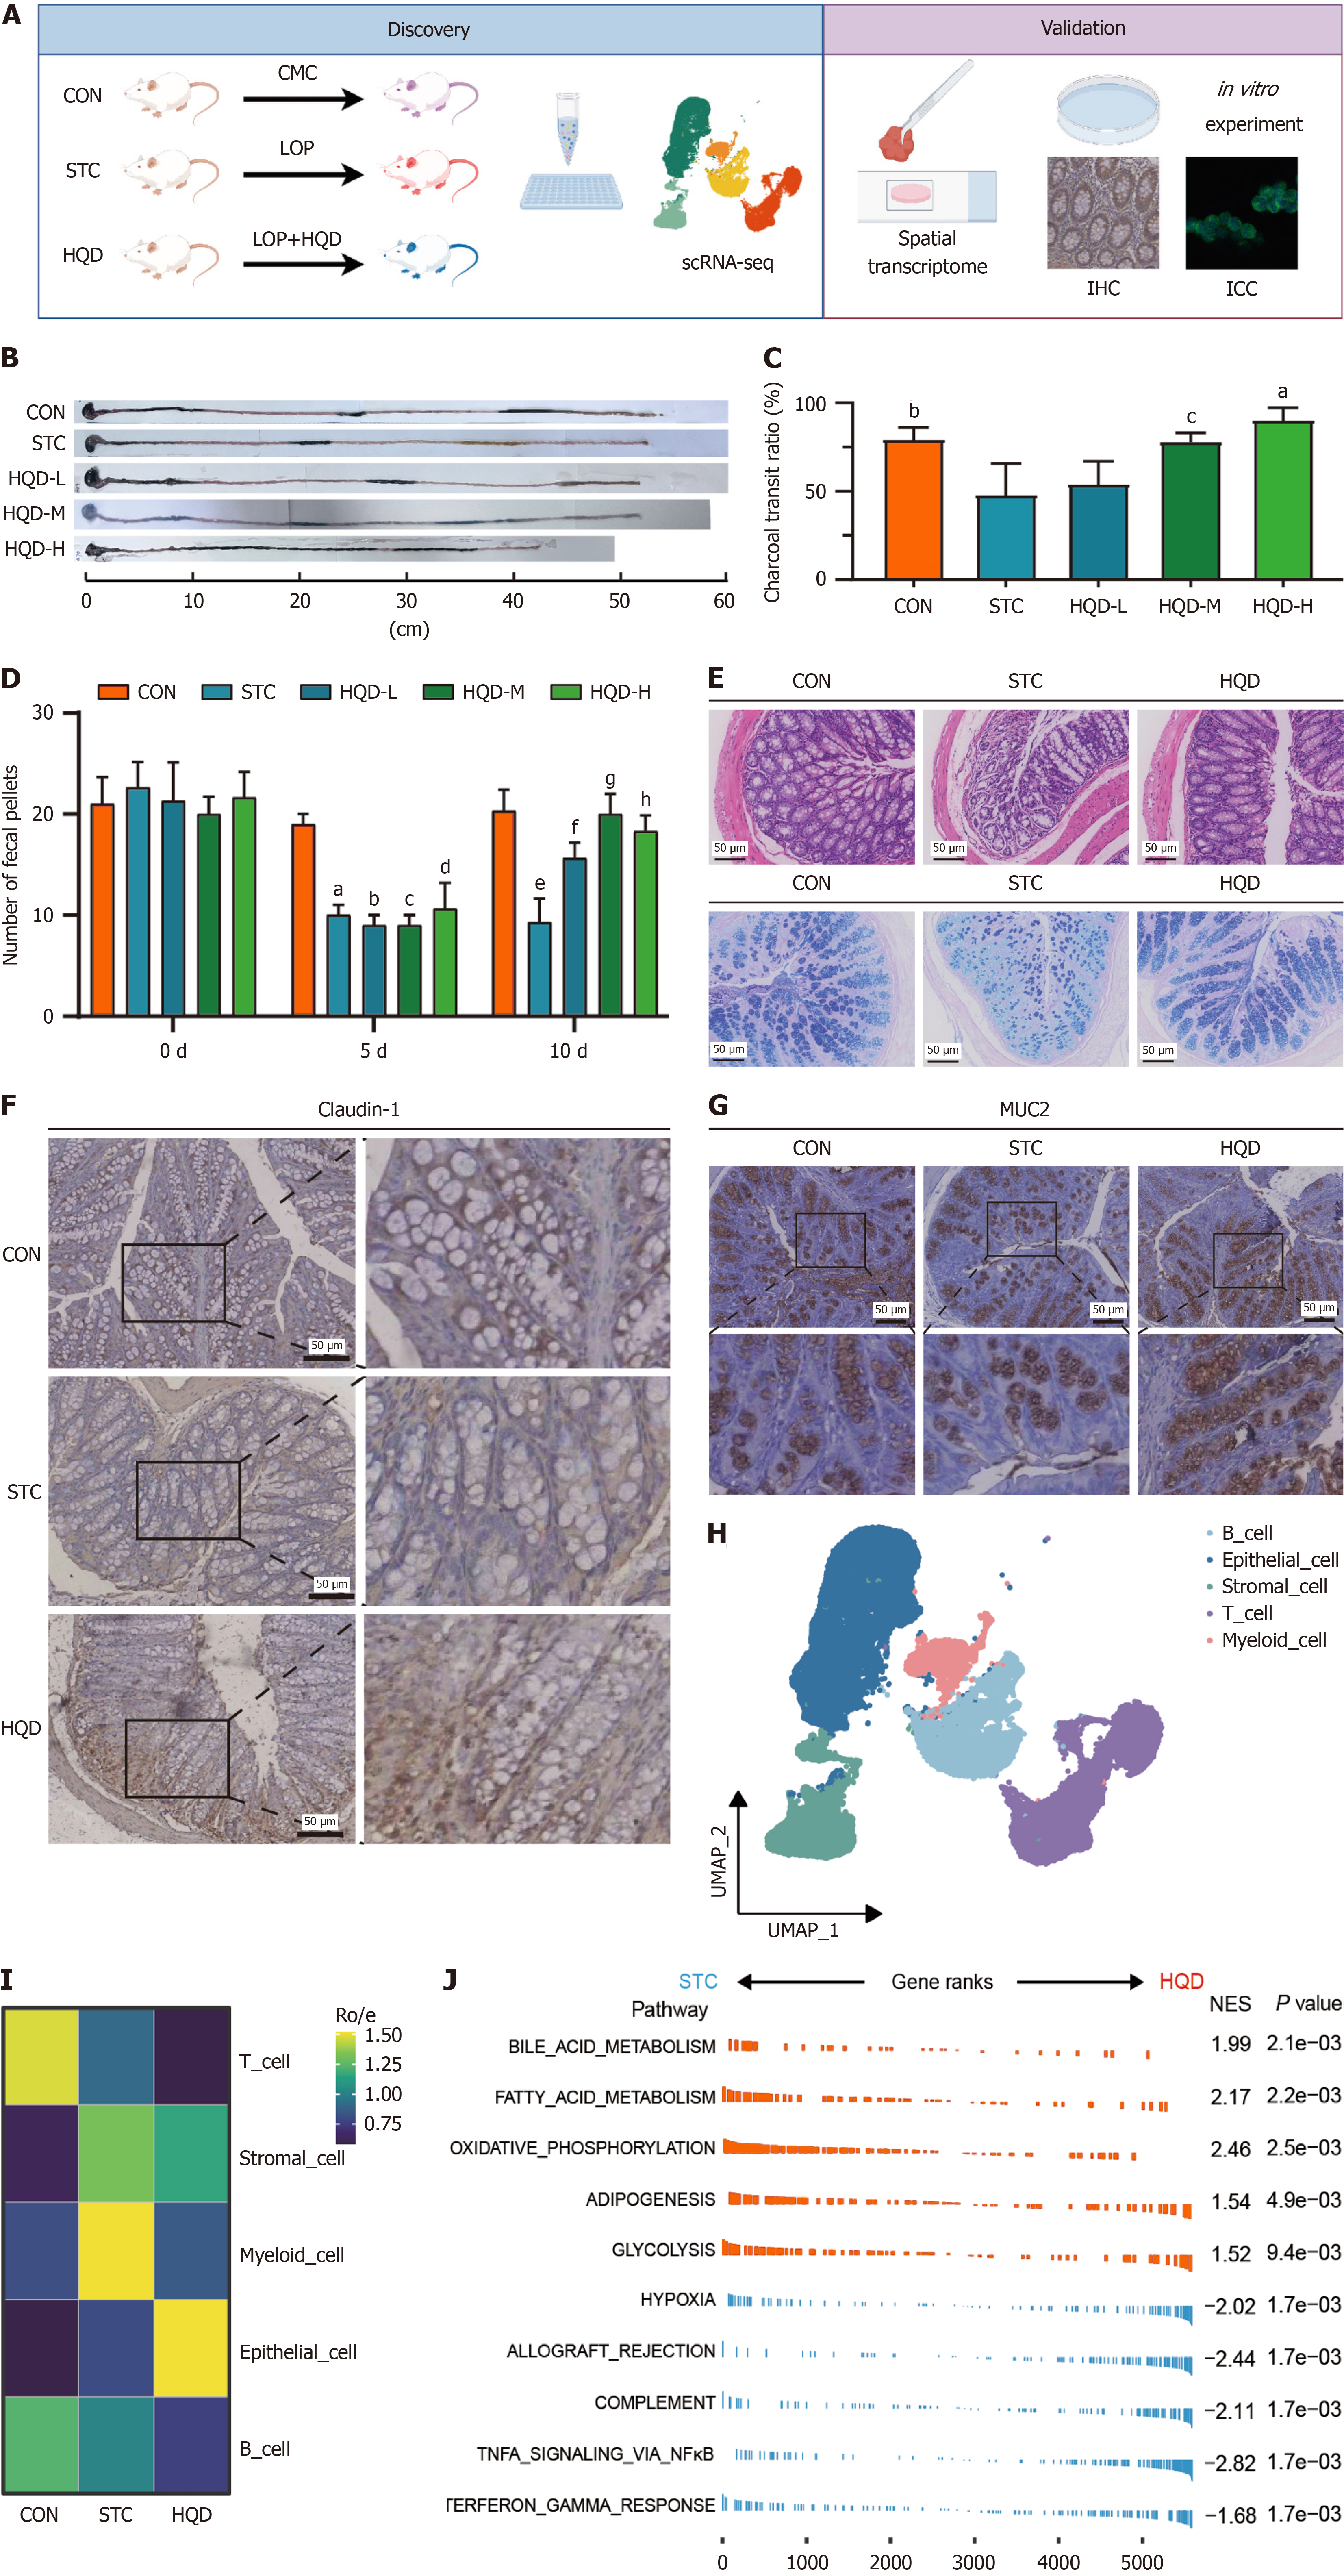
Figure 2 Huangqi decoction ameliorates defecation and intestinal barrier damage in constipation mice induced by loperamide.
A: Schematic overview of experimental design and analytical workflow. Figures generated with Figdraw; B: The effects of Huangqi decoction (HQD) treatment on intestinal charcoal transit in loperamide-induced slow transit constipation (STC) mice, scale bar 10 cm; C: The quantitative comparison of the intestinal transit charcoal ratio between the control group (CON), STC, and low, medium, and high dosage HQD groups. aP < 0.01, STC vs HQD high dose (HQD-H); bP < 0.05, STC vs CON; cP < 0.05, STC vs HQD medium dose (HQD-M); D: The quantitative comparison of the number of fecal pellets between the CON, STC, and low, medium, and high dosage HQD groups. aP < 0.001, STC vs CON (5 days); bP < 0.001, HQD low dose vs CON (5 days); cP < 0.001, HQD-M vs CON (5 days); dP < 0.001, HQD-H vs CON (5 days); eP < 0.001, STC vs CON (10 days); fP < 0.01, HQD low dose vs CON (10 days); gP < 0.001, HQD-M vs CON (10 days); hP < 0.001, HQD-H vs CON (10 days); E: Top: Representative images of hematoxylin and eosin staining colon mucosa of mice in CON, STC, and HQD group were shown. Bottom: Representative images of Alcian blue-periodic acid-Schiff staining colon mucosa of mice in CON, STC, and HQD group were shown. The black scale bar represents 50 μm; F: Representative images of the immunohistochemical expression levels of caudin-1 in the colonic mucosa of mice from the CON, STC, and HQD groups were shown. The black scale bar represents 50 μm; G: Representative images of the immunohistochemical expression levels of mucin 2 in the colonic mucosa of mice from the CON, STC, and HQD groups were shown. The black scale bar represents 50 μm; H: Uniform manifold approximation and projection plot of the major cell types from the mice colon tissue of the CON, STC, and HQD groups; I: Heatmap shows tissue distribution of cell types based on single-cell RNA sequencing data. Ro/e denotes the ratio of observed to expected cell number; J: Gene set enrichment analysis enrichment for gene sets in all cells comparing STC vs HQD group. CON: Control group; STC: Group of slow transit constipation model; HQD: Groups of treatment of Huangqi decoction; LOP: Loperamide; CMC: Carboxymethyl cellulose sodium; IHC: immunohistochemistry; ICC: Immunocytochemistry; HQD-L: HQD low dose; HQD-M: HQD medium dose; HQD-H: HQD high dose; NES: Normalize enrichment score.
- Citation: Chen HX, Xiao GZ, Yang CX, Zheng YH, Lei MY, Xu H, Ren DL, Huang L, He QL, Lin HC. Huangqi decoction ameliorated intestinal barrier dysfunction via regulating NF-κB signaling pathway in slow transit constipation model mice. World J Gastrointest Surg 2025; 17(5): 106000
- URL: https://www.wjgnet.com/1948-9366/full/v17/i5/106000.htm
- DOI: https://dx.doi.org/10.4240/wjgs.v17.i5.106000


