
















©The Author(s) 2025.
World J Gastrointest Surg. Oct 27, 2025; 17(10): 109407
Published online Oct 27, 2025. doi: 10.4240/wjgs.v17.i10.109407
Published online Oct 27, 2025. doi: 10.4240/wjgs.v17.i10.109407
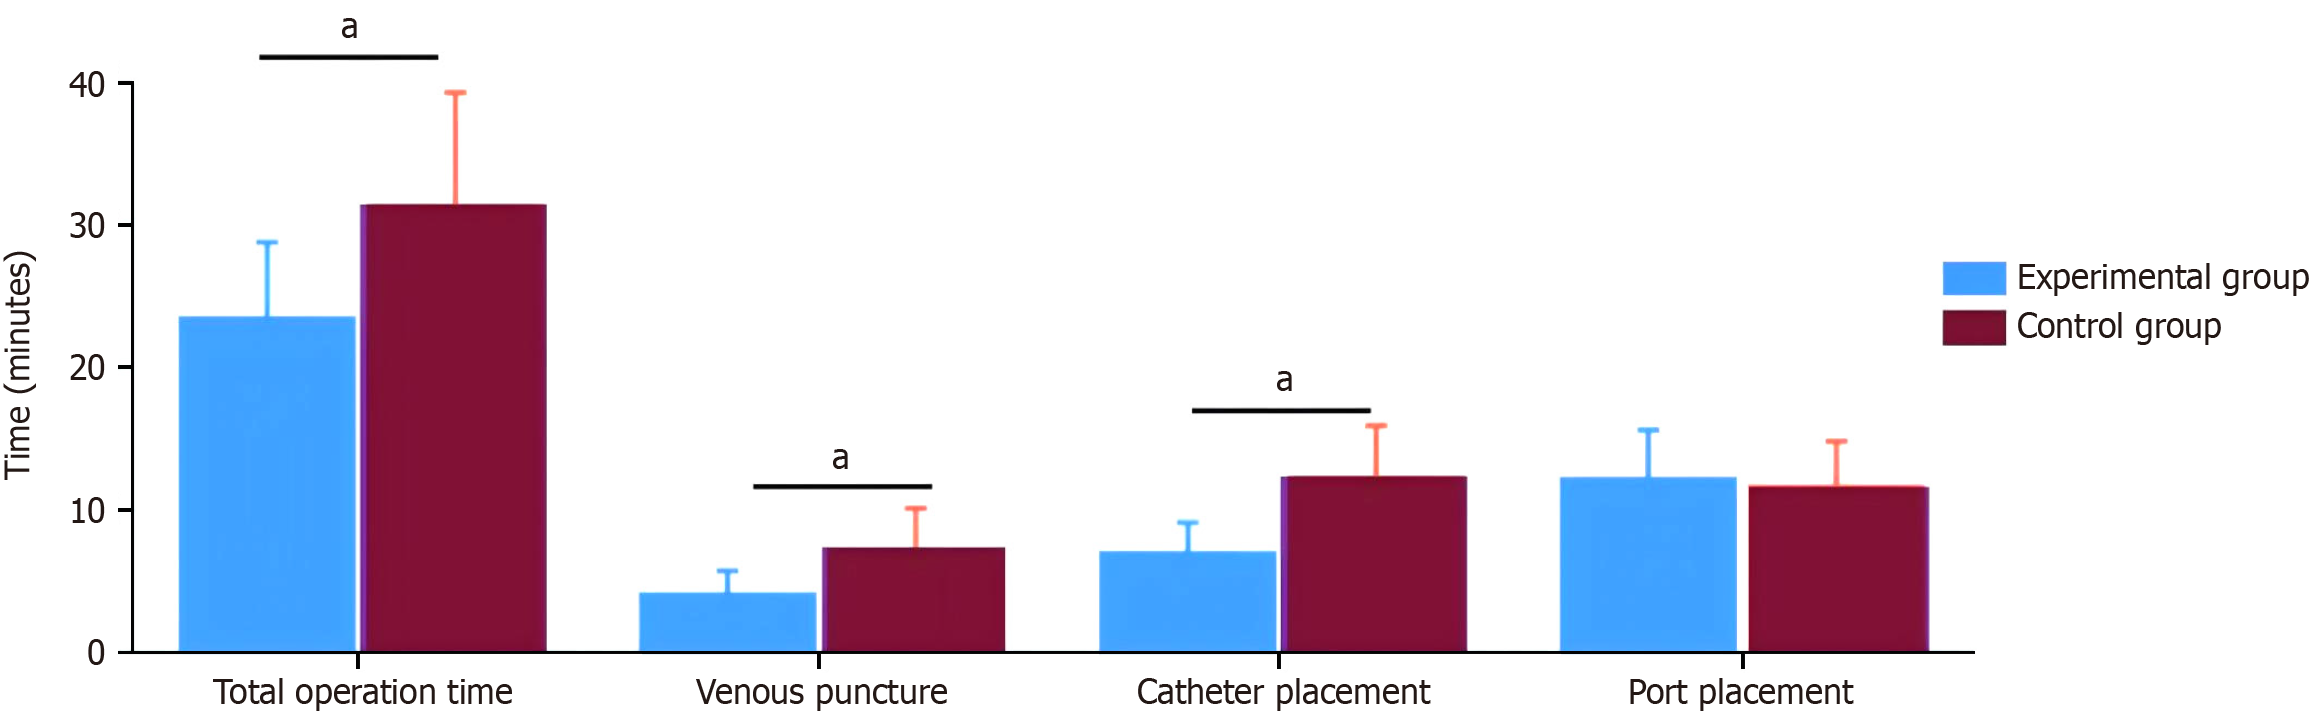
Figure 1 Comparison of operation time between experimental and control groups (minutes).
aP < 0.001. Figure 1 illustrates the significant reduction in operation time achieved by the experimental group (image pre-measurement combined with intracavitary electrocardiogram) compared to the control group (traditional anatomical landmark technique), with particularly notable differences in venous puncture (4.2 ± 1.5 minutes vs 7.3 ± 2.8 minutes, P < 0.001) and catheter placement (7.1 ± 2.0 minutes vs 12.4 ± 3.5 minutes, P < 0.001) phases. Total operation time was markedly shorter in the experimental group (23.6 ± 5.2 minutes vs 31.5 ± 7.8 minutes, P < 0.001), while port placement times showed no significant difference between groups (12.3 ± 3.3 minutes vs 11.8 ± 3.0 minutes, P = 0.245).
- Citation: Xie GL, Heng J, Jia XF, Li Q, Chang R, Zhang N, Xie LL, Gao C. Image and intracavitary electrocardiogram-guided arm port placement in colorectal cancer: A retrospective comparative study. World J Gastrointest Surg 2025; 17(10): 109407
- URL: https://www.wjgnet.com/1948-9366/full/v17/i10/109407.htm
- DOI: https://dx.doi.org/10.4240/wjgs.v17.i10.109407