Copyright
©The Author(s) 2024.
World J Gastrointest Surg. Mar 27, 2024; 16(3): 717-730
Published online Mar 27, 2024. doi: 10.4240/wjgs.v16.i3.717
Published online Mar 27, 2024. doi: 10.4240/wjgs.v16.i3.717
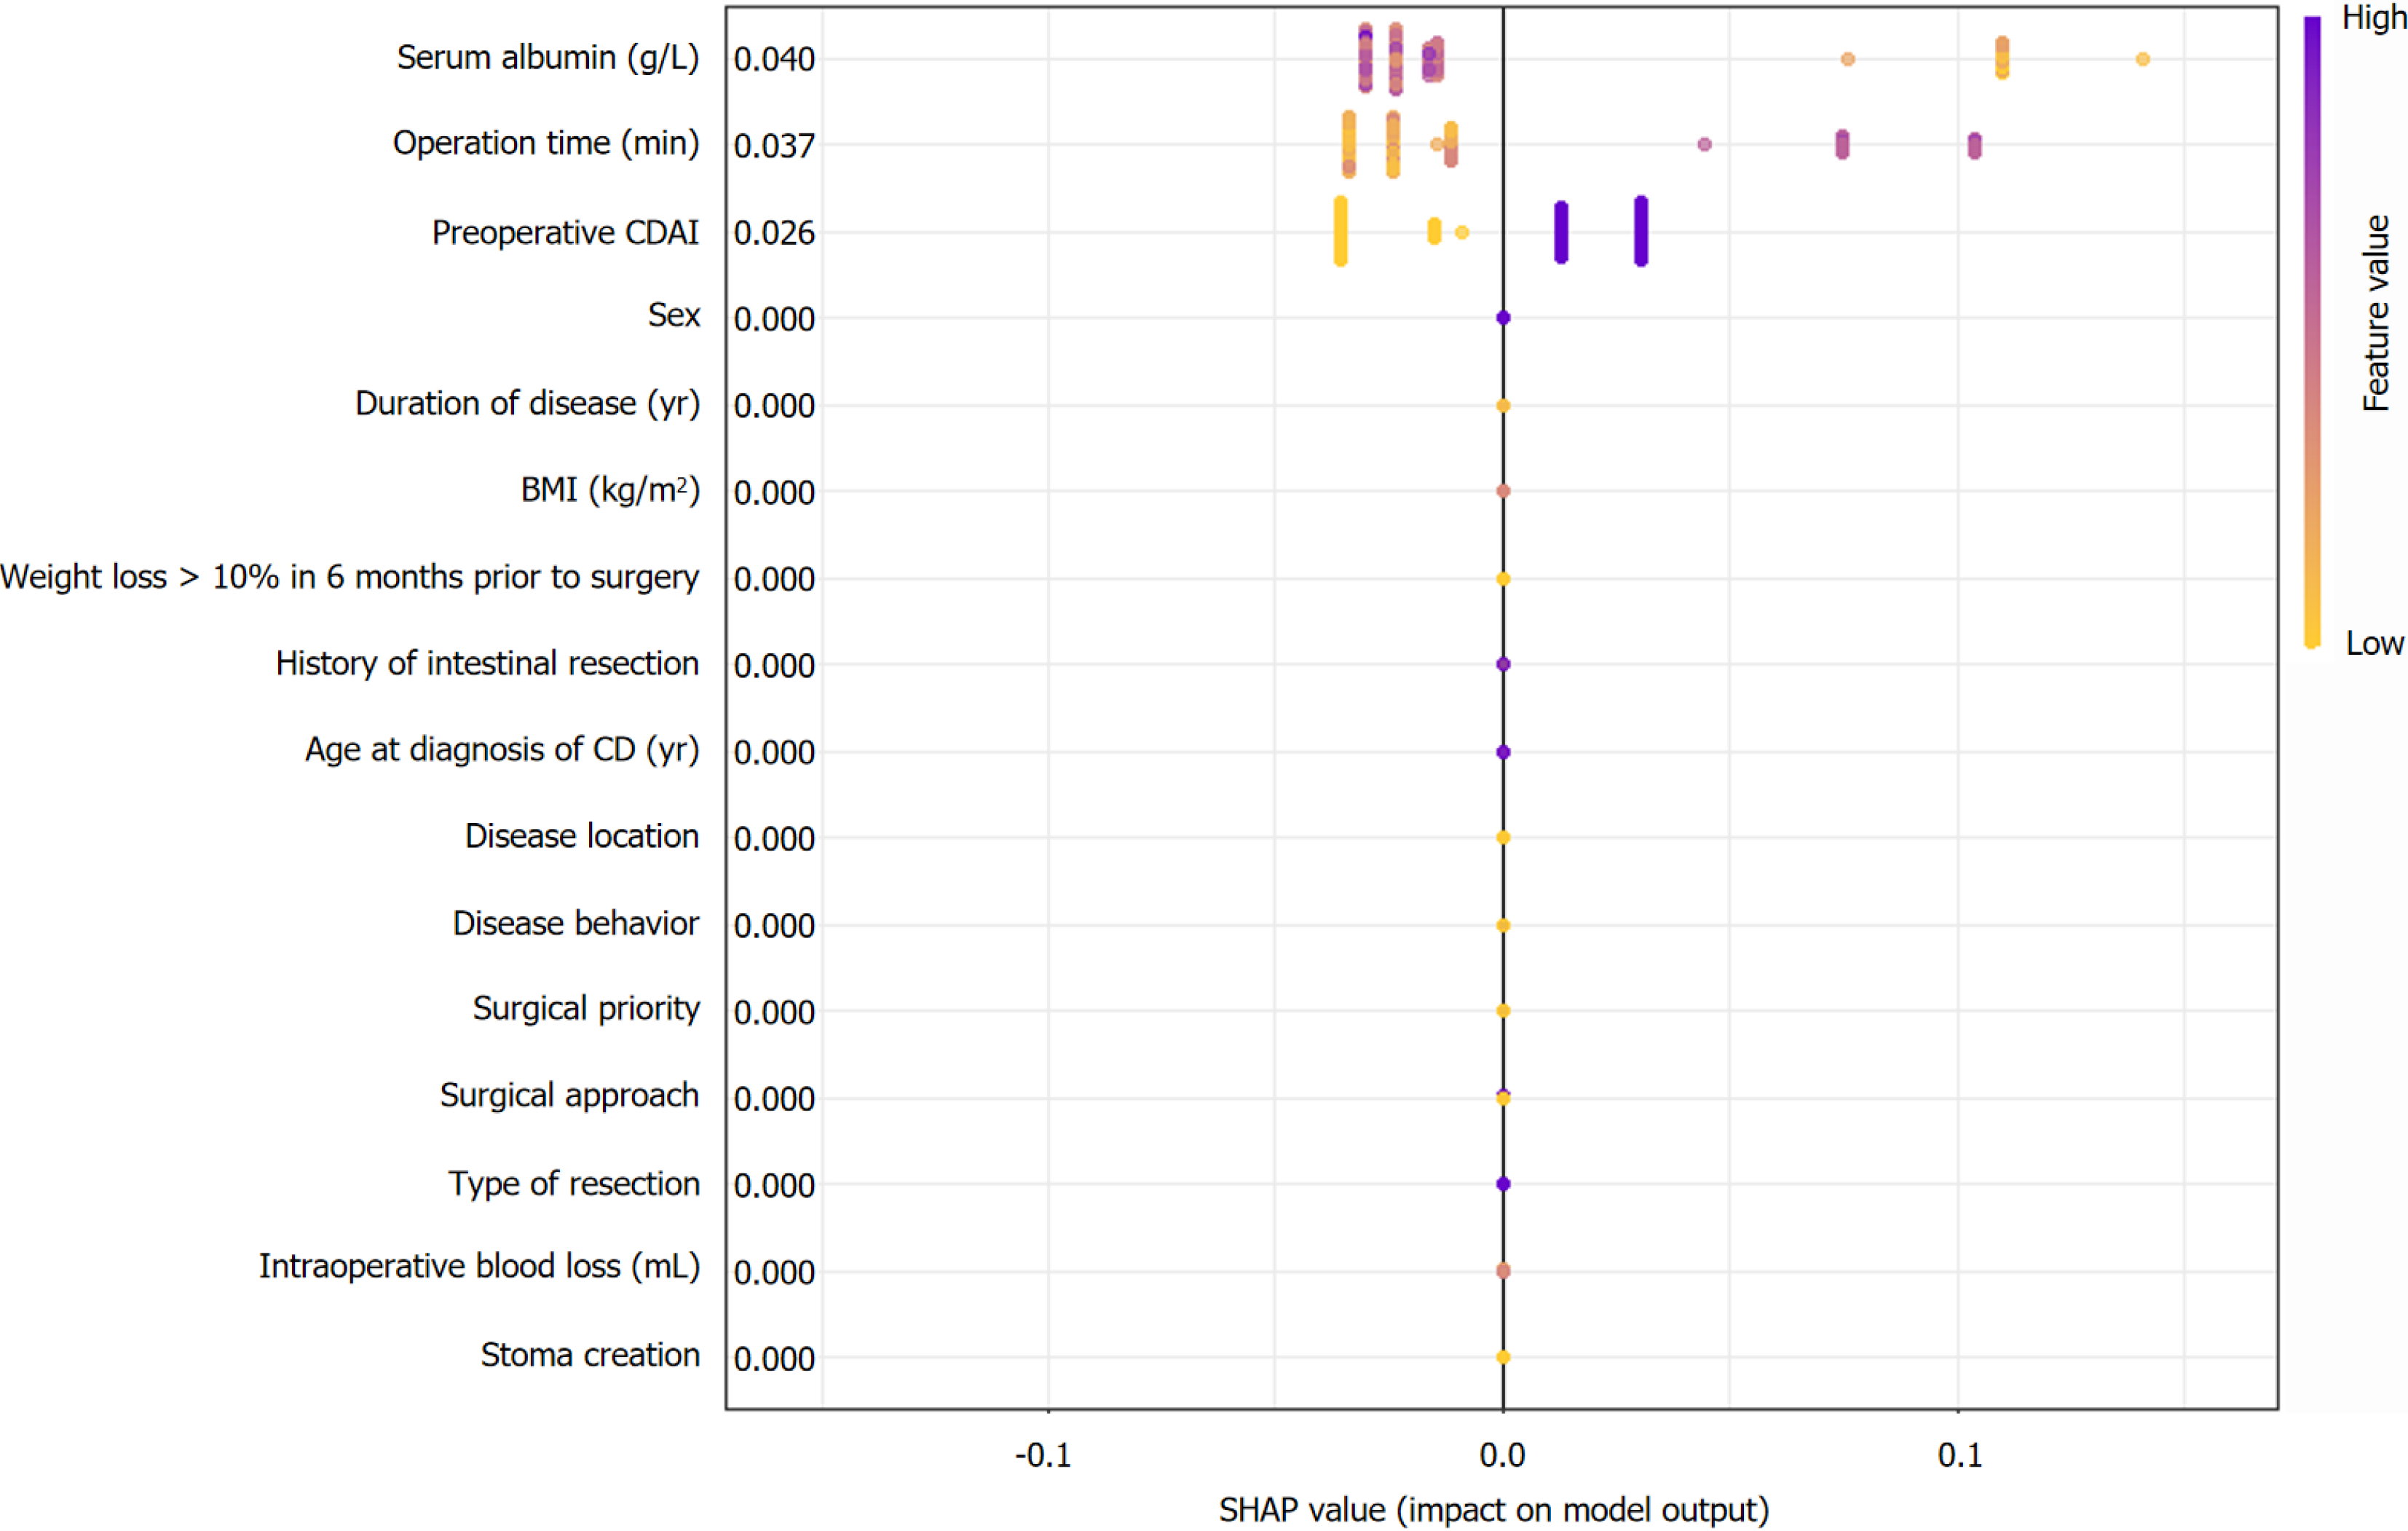
Figure 5 SHapley Additive exPlanations summary plots of the random forest model.
The y-coordinate of each point is determined by the feature it represents, while the x-coordinate is determined by its impact on the model’s output. The color of each point indicates its value from high to low, according to the color bar on the right. The features on the y-axis are ordered by their importance. CDAI: Crohn’s disease activity index; BMI: Body mass index; CD: Crohn’s disease; SHAP: SHapley Additive exPlanations.
- Citation: Wang FT, Lin Y, Yuan XQ, Gao RY, Wu XC, Xu WW, Wu TQ, Xia K, Jiao YR, Yin L, Chen CQ. Predicting short-term major postoperative complications in intestinal resection for Crohn’s disease: A machine learning-based study. World J Gastrointest Surg 2024; 16(3): 717-730
- URL: https://www.wjgnet.com/1948-9366/full/v16/i3/717.htm
- DOI: https://dx.doi.org/10.4240/wjgs.v16.i3.717


