Copyright
©The Author(s) 2022.
World J Gastrointest Surg. Dec 27, 2022; 14(12): 1350-1362
Published online Dec 27, 2022. doi: 10.4240/wjgs.v14.i12.1350
Published online Dec 27, 2022. doi: 10.4240/wjgs.v14.i12.1350
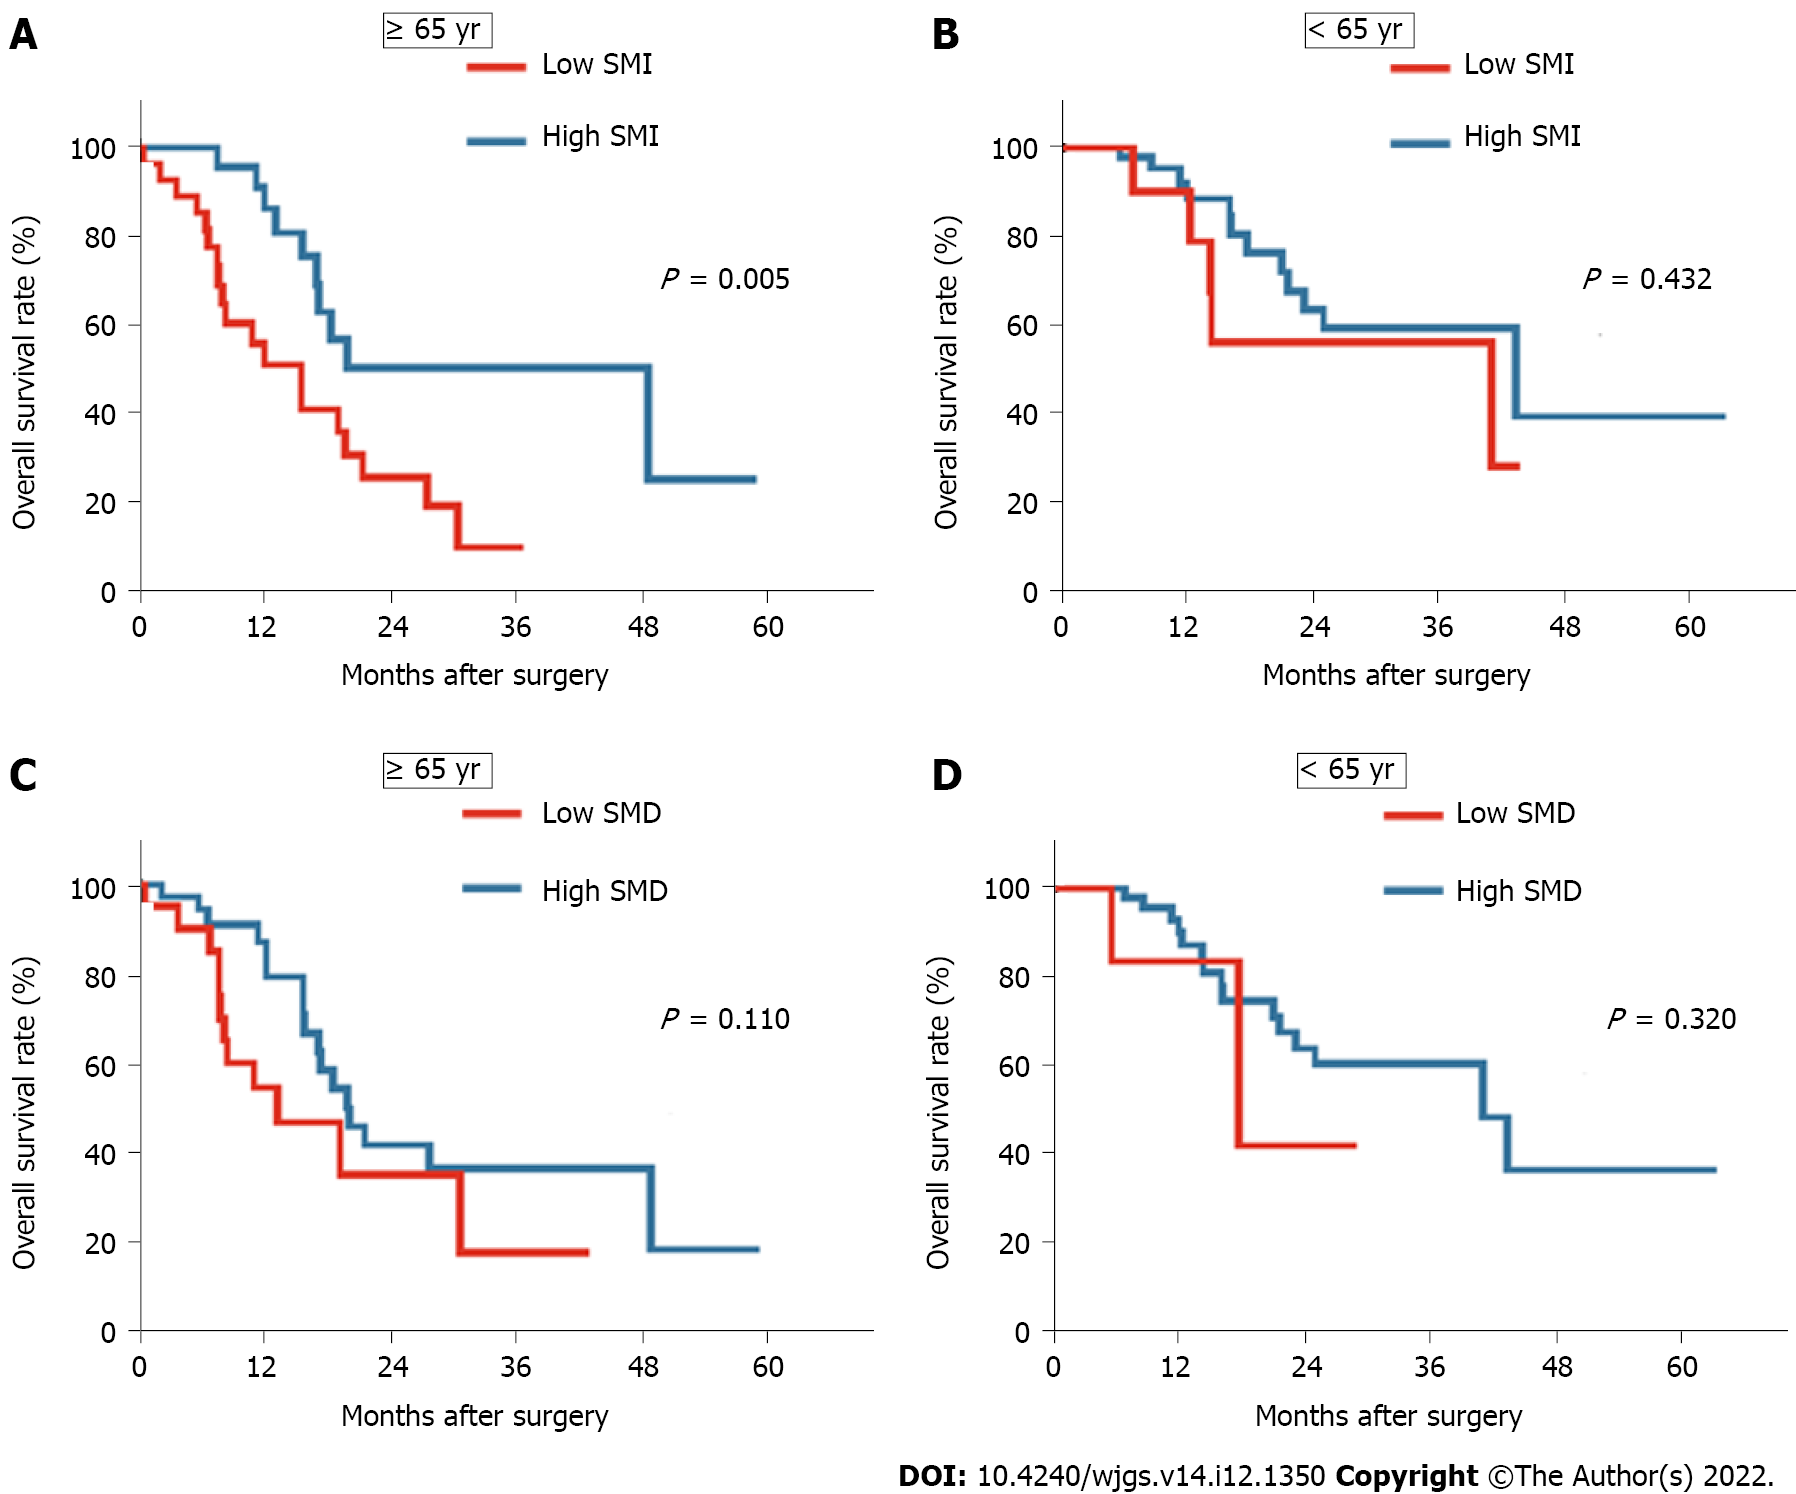
Figure 3 Kaplan Meier overall survival curves of the cohort stratified by age.
A and C: Overall survival (OS) curves for patients aged 65 and older stratified according to skeletal muscle index (SMI) (A) and skeletal muscle density (SMD) (C); B and D: OS curves for patients aged younger than 65 yr stratified by SMI (B) and SMD (D). SMI: Skeletal muscle index; SMD: Skeletal muscle density.
- Citation: Cai ZW, Li JL, Liu M, Wang HW, Jiang CY. Low preoperative skeletal muscle index increases the risk of mortality among resectable pancreatic cancer patients: A retrospective study. World J Gastrointest Surg 2022; 14(12): 1350-1362
- URL: https://www.wjgnet.com/1948-9366/full/v14/i12/1350.htm
- DOI: https://dx.doi.org/10.4240/wjgs.v14.i12.1350


