Copyright
©The Author(s) 2023.
World J Gastrointest Surg. Mar 27, 2023; 15(3): 374-386
Published online Mar 27, 2023. doi: 10.4240/wjgs.v15.i3.374
Published online Mar 27, 2023. doi: 10.4240/wjgs.v15.i3.374
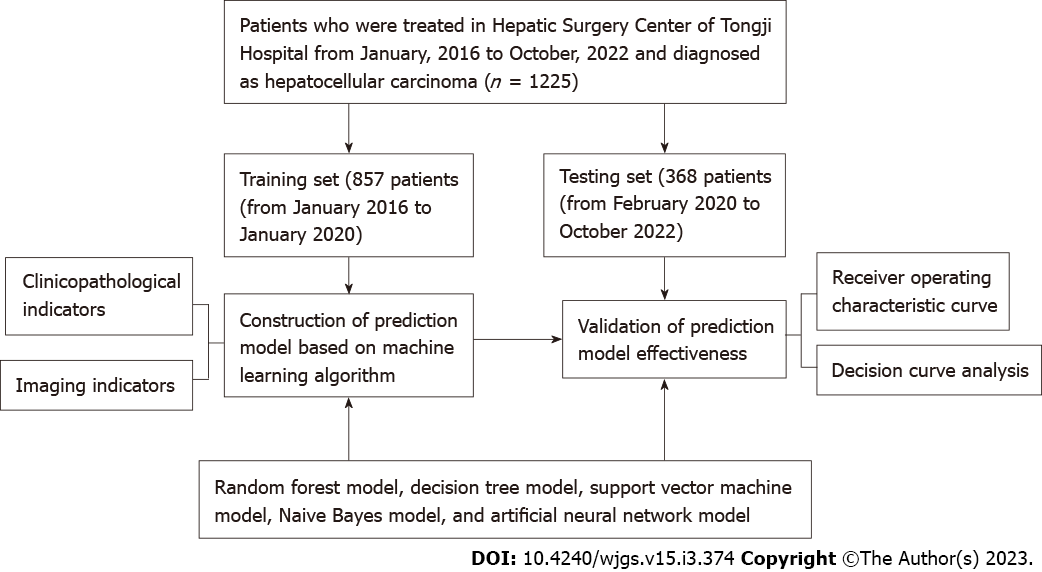
Figure 1 Flow chart of patient inclusion and prediction model construction.
Figure 2 Variable screening and weight allocation.
A: Correlation matrix analysis of candidate features; B and C: Feature selection by least absolute shrinkage and selection operator regression; D: The weight distribution of the candidate variables of each ML-based model. BMI: Body mass index; ECOG: Eastern Cooperative Oncology Group; TACE: Transcatheter arterial chemoembolisation; HHS: History of hepatobiliary surgery; PrP: Preoperative pain; MDT: Maximum tumor diameter; LOET: Location of embolized tumor; NOET: Number of embolised tumours; PVTT: Portal vein tumor thrombus; DFLS: Distance from the liver capsule; CTPG: Child-pugh grade; OpD: Operation_duration; ES: Embolization supplement; LOD: Iodine oil dosage; PT: Prothrombin time; PTA: Prothrombin activity; TBIL: Total bilirubin; ALT: Alanine aminotransferase; AST: Aspartate aminotransferase; PLT: Platelet count; RFM: Random forest model; DTM: Decision tree model; SVMM: Support vector machine model; NBM: Naive Bayes model; ANNM: Artificial neural network model.
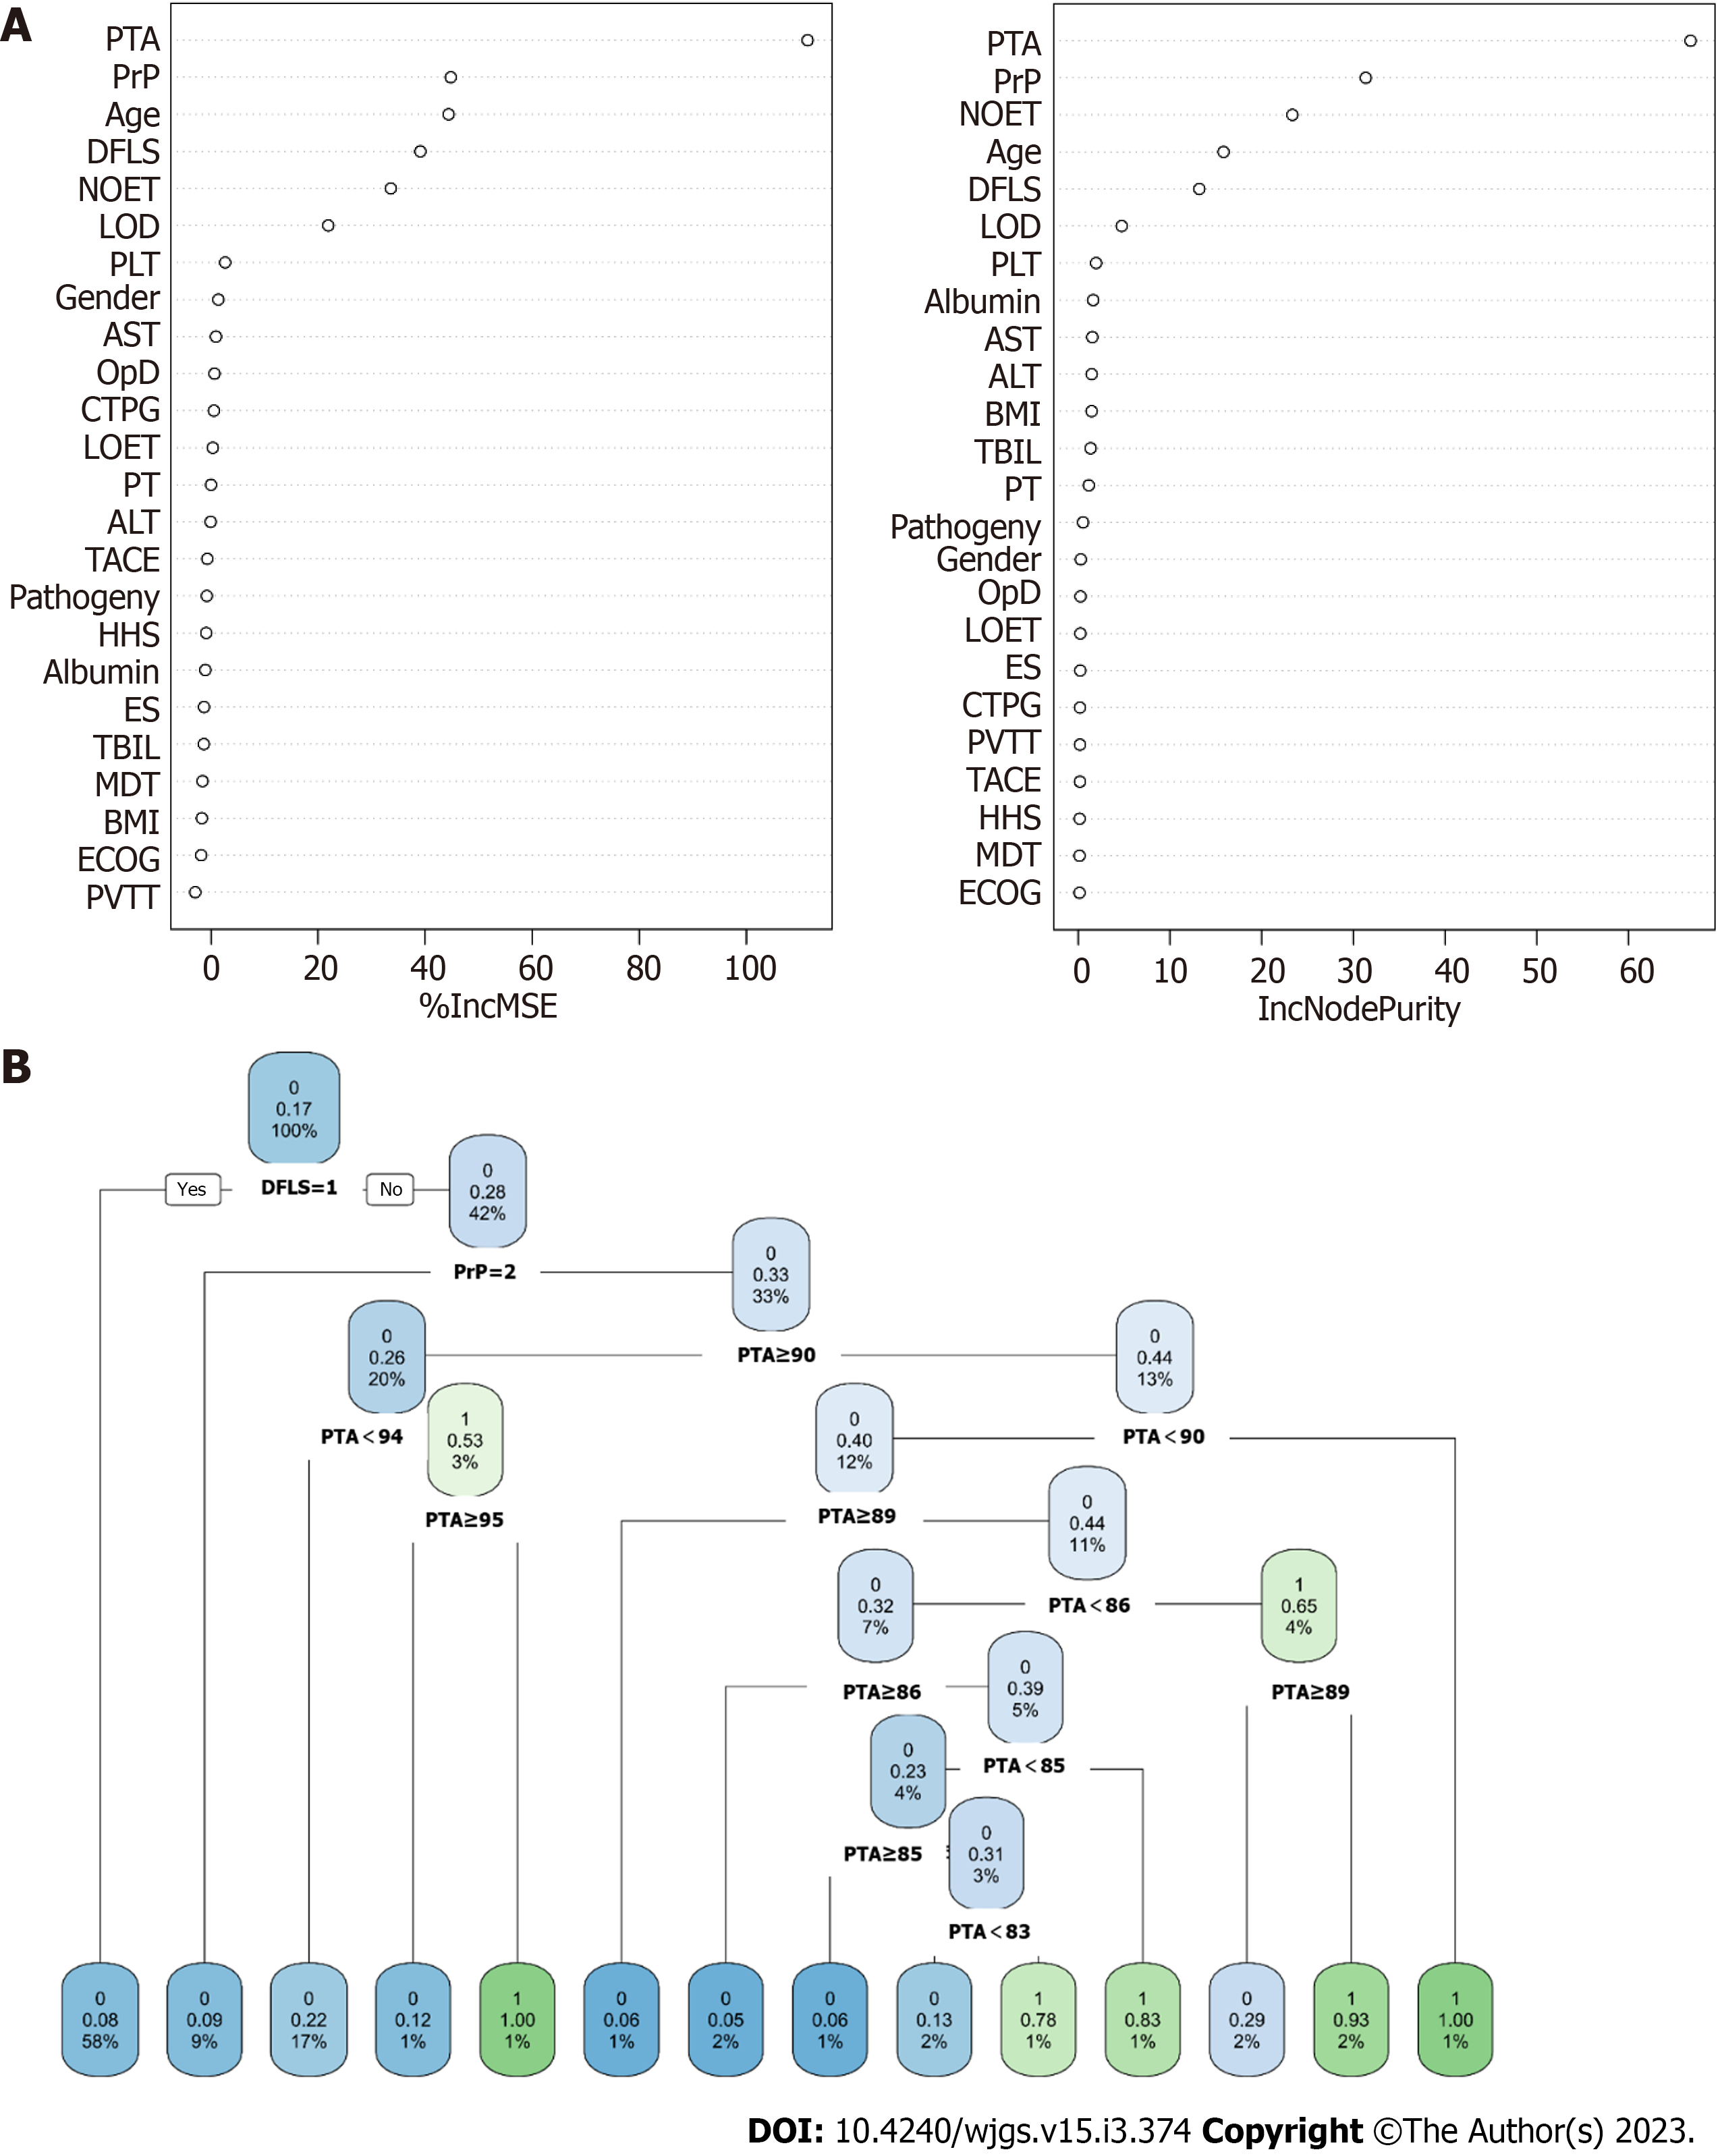
Figure 3 Predictive model visualization based on machine learning-based algorithm.
A: Random forest model; B: Decision tree model. The candidate factors associated with fracture risk were ordered via random forest algorithm (A) and (B) prediction node and weight were allocated via decision tree algorithm. BMI: Body mass index; ECOG: Eastern Cooperative Oncology Group; TACE: Transcatheter arterial chemoembolisation; HHS: History of hepatobiliary surgery; PrP: Preoperative pain; MDT: Maximum tumor diameter; LOET: Location of embolized tumor; NOET: Number of embolised tumours; PVTT: Portal vein tumor thrombus; DFLS: Distance from the liver capsule; CTPG: Child-pugh grade; OpD: Operation_duration; ES: Embolization supplement; LOD: Iodine oil dosage; PT: Prothrombin time; PTA: Preoperative prothrombin activity; TBIL: Total bilirubin; ALT: Alanine aminotransferase; AST: Aspartate aminotransferase; PLT: Platelet count; RFM: Random forest model; DTM: Decision tree model; SVMM: Support vector machine model; NBM: Naive Bayes model; ANNM: Artificial neural network model.
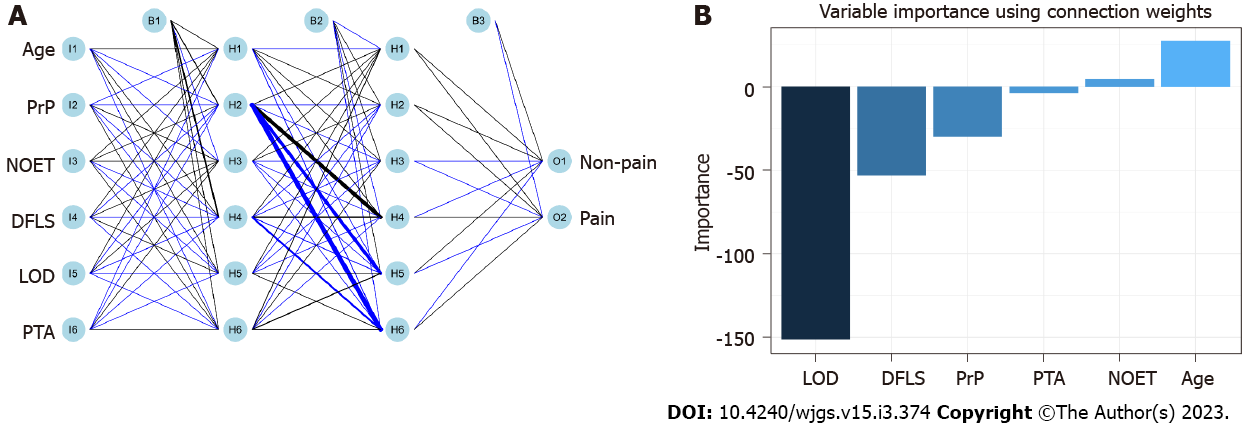
Figure 4 Predictive model visualization based on artificial neural network model algorithm.
A: Artificial neural network model; B: Variable importance using connection weight. PrP: Preoperative pain; NOET: Number of embolised tumours; DFLS: Distance from the liver capsule; LOD: Iodine oil dosage; PTA: Preoperative prothrombin activity.
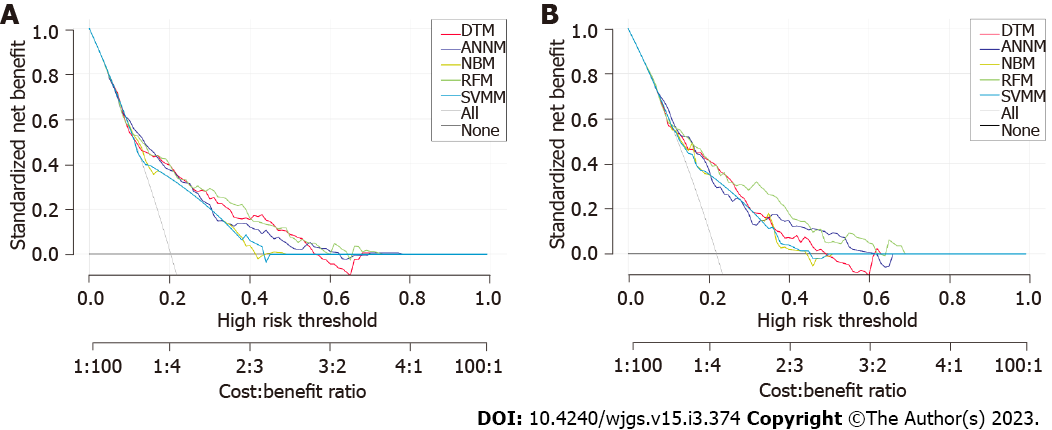
Figure 5 Prediction pain risk performance of candidate models based on machine learning-based algorithm.
A: Decision curve analysis (DCA) for five machine learning (ML)-based models in the training set; B: DCA for five ML-based models in the testing set. DTM: Decision tree model; ANNM: Artificial neural network model; NBM: Naive Bayes model; RFM: Random forest model; SVMM: Support vector machine model.
- Citation: Guan Y, Tian Y, Fan YW. Pain management in patients with hepatocellular carcinoma after transcatheter arterial chemoembolisation: A retrospective study. World J Gastrointest Surg 2023; 15(3): 374-386
- URL: https://www.wjgnet.com/1948-9366/full/v15/i3/374.htm
- DOI: https://dx.doi.org/10.4240/wjgs.v15.i3.374


