Copyright
©The Author(s) 2015.
World J Diabetes. Feb 15, 2015; 6(1): 184-191
Published online Feb 15, 2015. doi: 10.4239/wjd.v6.i1.184
Published online Feb 15, 2015. doi: 10.4239/wjd.v6.i1.184
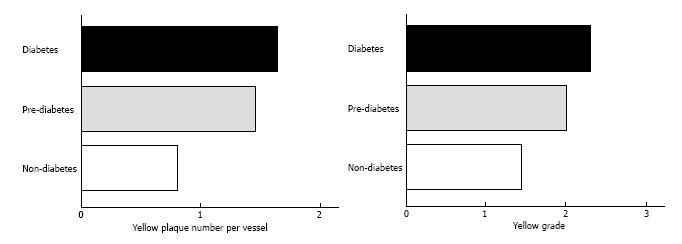
Figure 5 Comparisons of yellow plaque detected by coronary angioscopy among the 3 groups.
A: Average number of yellow plaques per vessel; B: Average maximum yellow grade per coronary artery (MYG). The number of yellow plaques per vessel and maximum yellow grade per coronary artery in the prediabetic group were greater than those in the nondiabetic group (P = 0.017 and P = 0.040, respectively), whereas they were similar to those in the diabetic group (P = 0.44 and P = 0.21, respectively).
- Citation: Kurihara O, Takano M, Seino Y, Shimizu W, Mizuno K. Coronary atherosclerosis is already ongoing in pre-diabetic status: Insight from intravascular imaging modalities. World J Diabetes 2015; 6(1): 184-191
- URL: https://www.wjgnet.com/1948-9358/full/v6/i1/184.htm
- DOI: https://dx.doi.org/10.4239/wjd.v6.i1.184


