Copyright
©The Author(s) 2015.
World J Diabetes. Feb 15, 2015; 6(1): 184-191
Published online Feb 15, 2015. doi: 10.4239/wjd.v6.i1.184
Published online Feb 15, 2015. doi: 10.4239/wjd.v6.i1.184
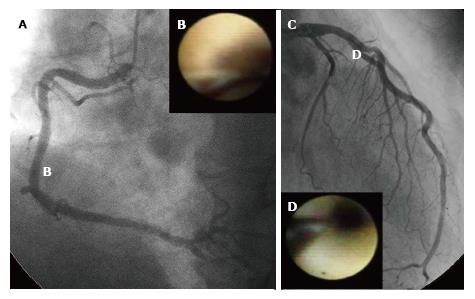
Figure 2 Representative images of nondiabetic patients.
A and B: No angiographic stenosis was observed in the right coronary artery (A), whereas 1 yellow plaque was identified on angioscopy (B). The yellow intensity of these plaques was defined as grade 2; C: The left circumflex artery was too small to observe by coronary angioscopy, and a 75% stenosis was identified on angiography in the middle part of the left ascending artery; D: According to angioscopic findings, this lesion was evaluated as a grade 1 yellow plaque. In this case, the average number of yellow plaques per vessel was 1 (2 yellow plaques in 2 vessels), and the maximum yellow grade per coronary artery was 2.
- Citation: Kurihara O, Takano M, Seino Y, Shimizu W, Mizuno K. Coronary atherosclerosis is already ongoing in pre-diabetic status: Insight from intravascular imaging modalities. World J Diabetes 2015; 6(1): 184-191
- URL: https://www.wjgnet.com/1948-9358/full/v6/i1/184.htm
- DOI: https://dx.doi.org/10.4239/wjd.v6.i1.184


