
















Copyright: ©Author(s) 2026.
World J Diabetes. Oct 15, 2026; 17(10): 123730
Published online Oct 15, 2026. doi: 10.4239/wjd.123730
Published online Oct 15, 2026. doi: 10.4239/wjd.123730
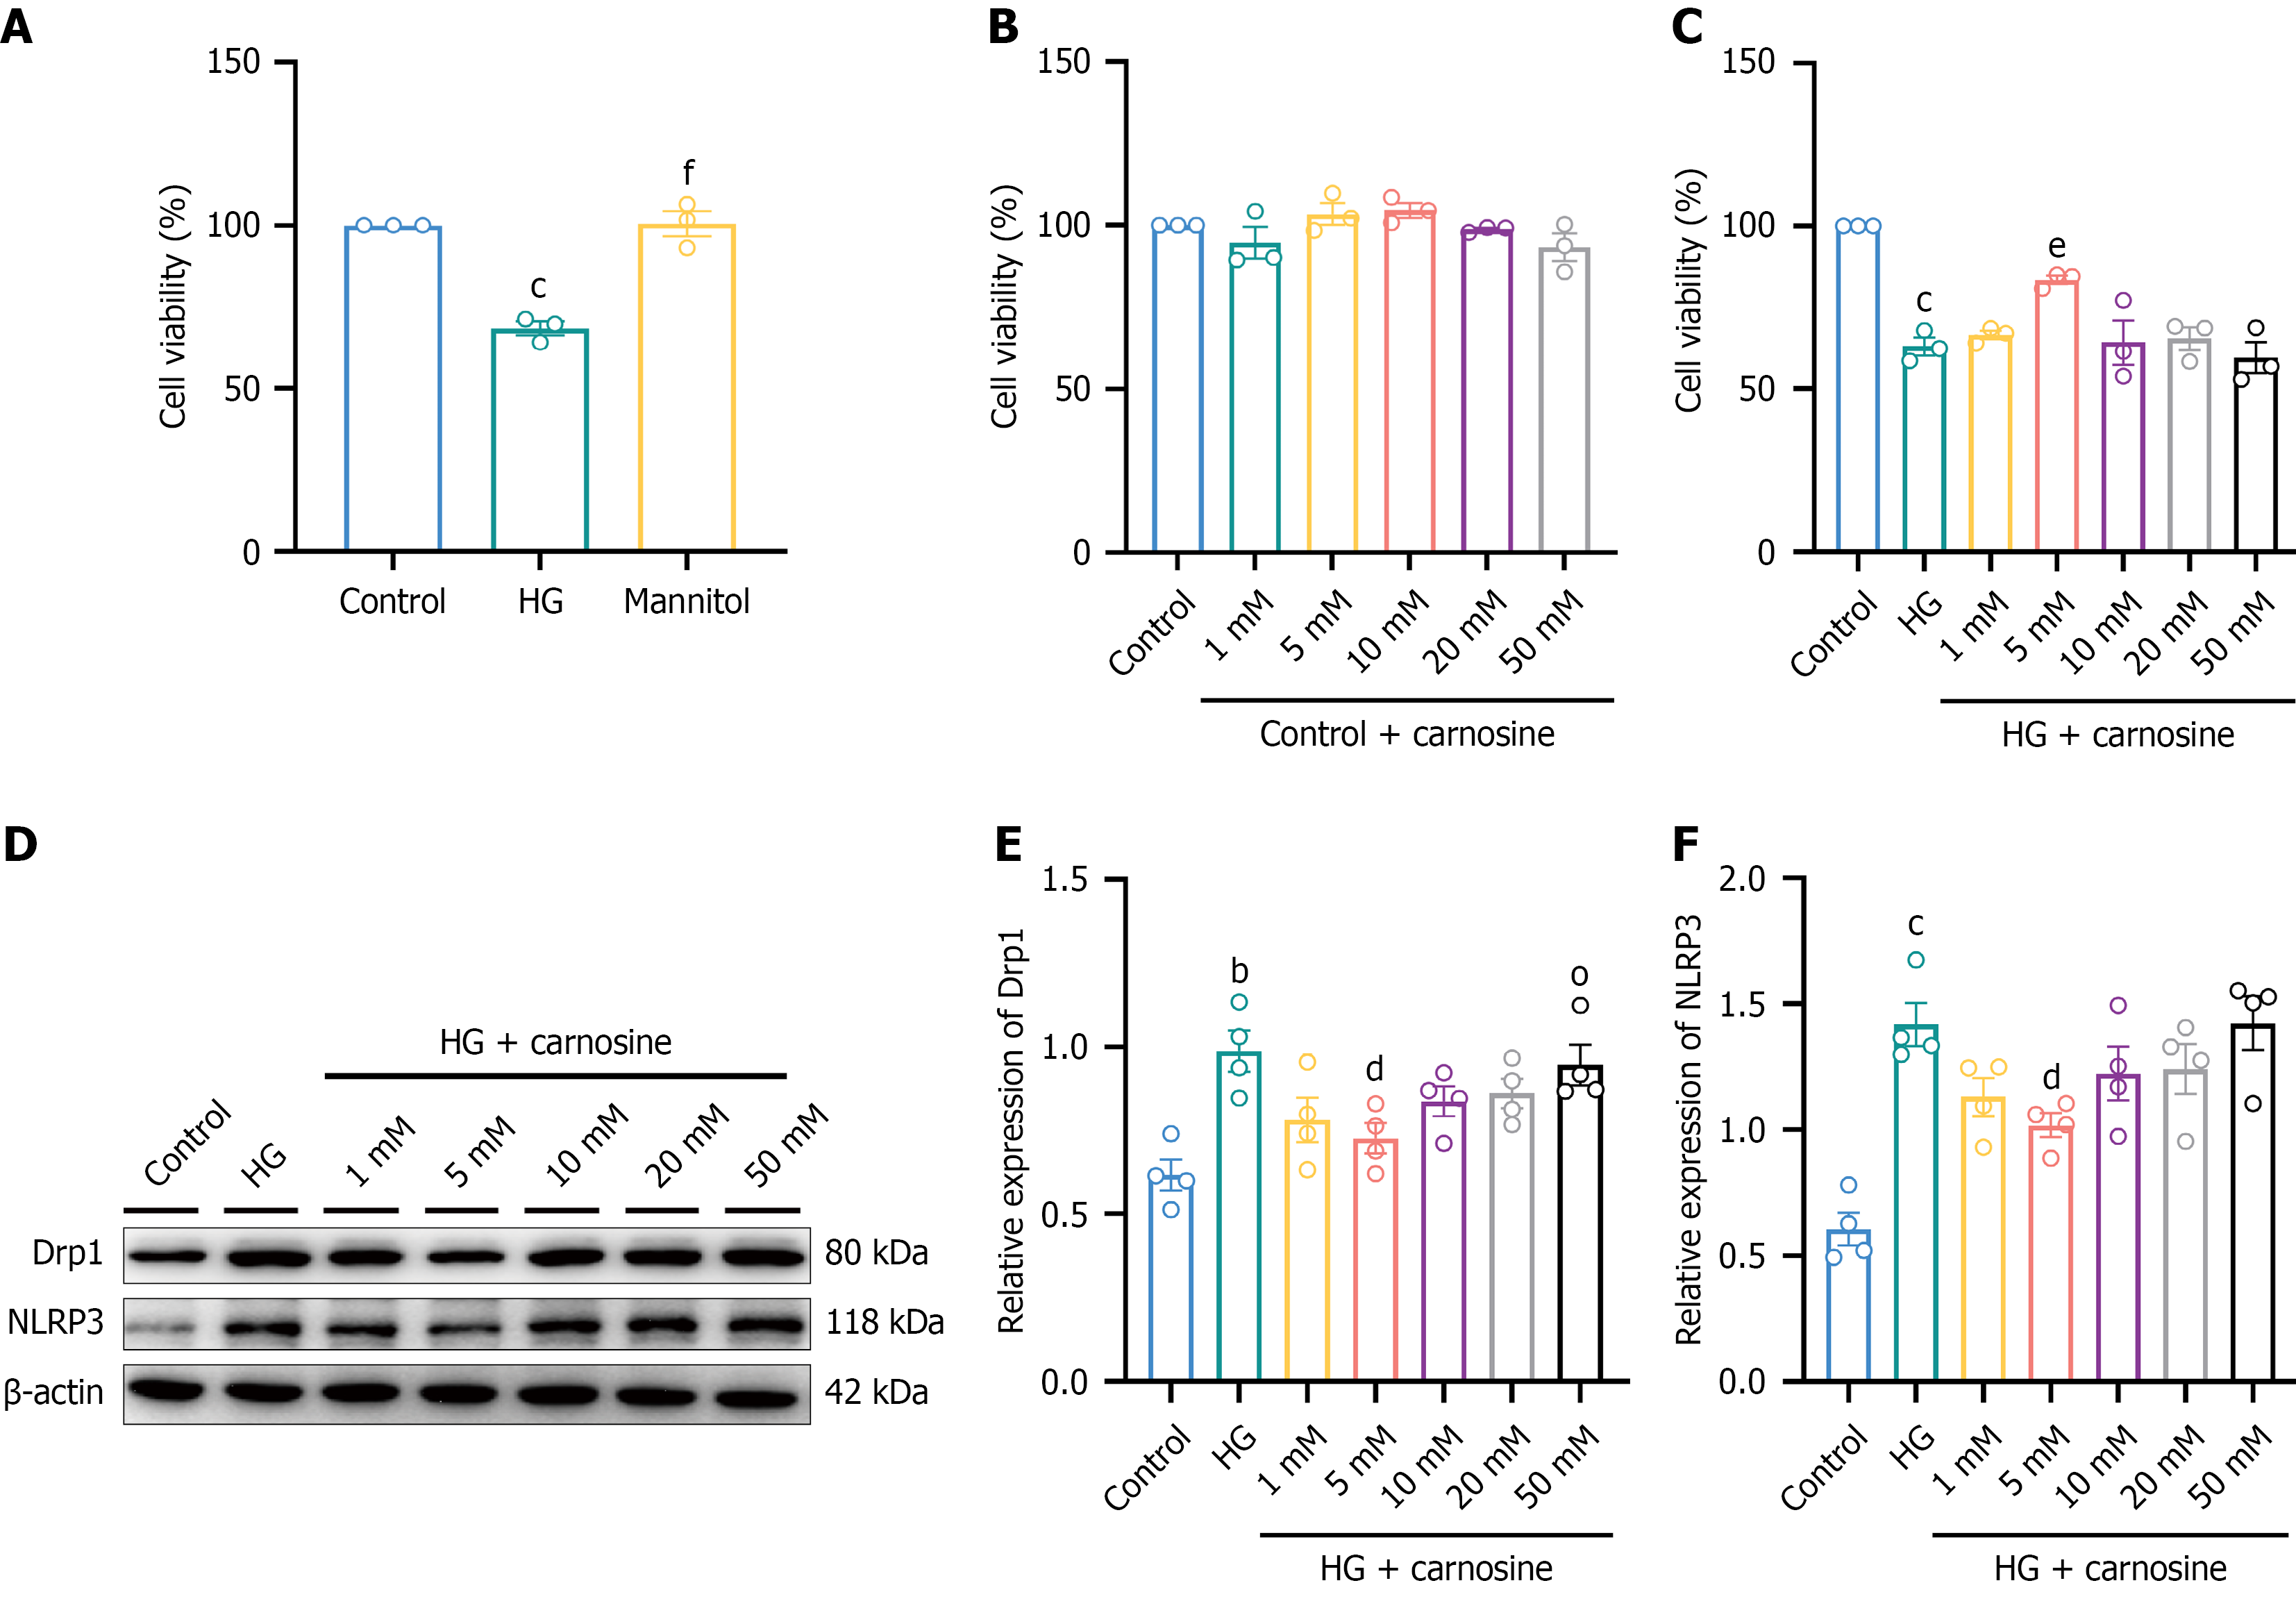
Figure 5 The screening of optimal carnosine concentration in PC12 cells.
bP < 0.01, cP < 0.001 vs the control group; dP < 0.05, eP < 0.01, fP < 0.001 vs the high-glucose (HG) group. One-way analysis of variance with Tukey’s multiple comparisons test for Figure 5A-C, E and F. For Figure 5A-C, n = 3; for Figure 5D-F, n = 4. A: Cell counting kit-8 (CCK-8) assay of viability in PC12 cells treated with HG and mannitol; B: CCK-8 assay of viability in PC12 cells treated with various concentrations of carnosine in a standard culture medium; C: CCK-8 assay of viability in PC12 cells treated with different concentrations of carnosine in a HG culture medium; D-F: Western blotting indicating changes in the expression levels of mitochondrial fission protein dynamin-related protein 1 and NOD-like receptor pyrin domain-containing protein 3 inflammasome in PC12 cells treated with various concentrations of carnosine in a HG culture medium. NLRP3: NOD-like receptor pyrin domain-containing protein 3; Drp1: Dynamin-related protein 1; HG: High-glucose.
- Citation: Yu ZY, Yang J, Jiang Y, Han YZ, Wei M, Shou JY, Shen SX, Lyu YH, Li XS, Chen Q, Zhao XR, Xing GG, Ma DQ, Li M. Preventive carnosine supplementation attenuates painful diabetic neuropathy via restoring mitochondrial function and suppressing inflammasome activation. World J Diabetes 2026; 17(10): 123730
- URL: https://www.wjgnet.com/1948-9358/full/v17/i10/123730.htm
- DOI: https://dx.doi.org/10.4239/wjd.123730