Copyright
©The Author(s) 2025.
World J Diabetes. Aug 15, 2025; 16(8): 108101
Published online Aug 15, 2025. doi: 10.4239/wjd.v16.i8.108101
Published online Aug 15, 2025. doi: 10.4239/wjd.v16.i8.108101
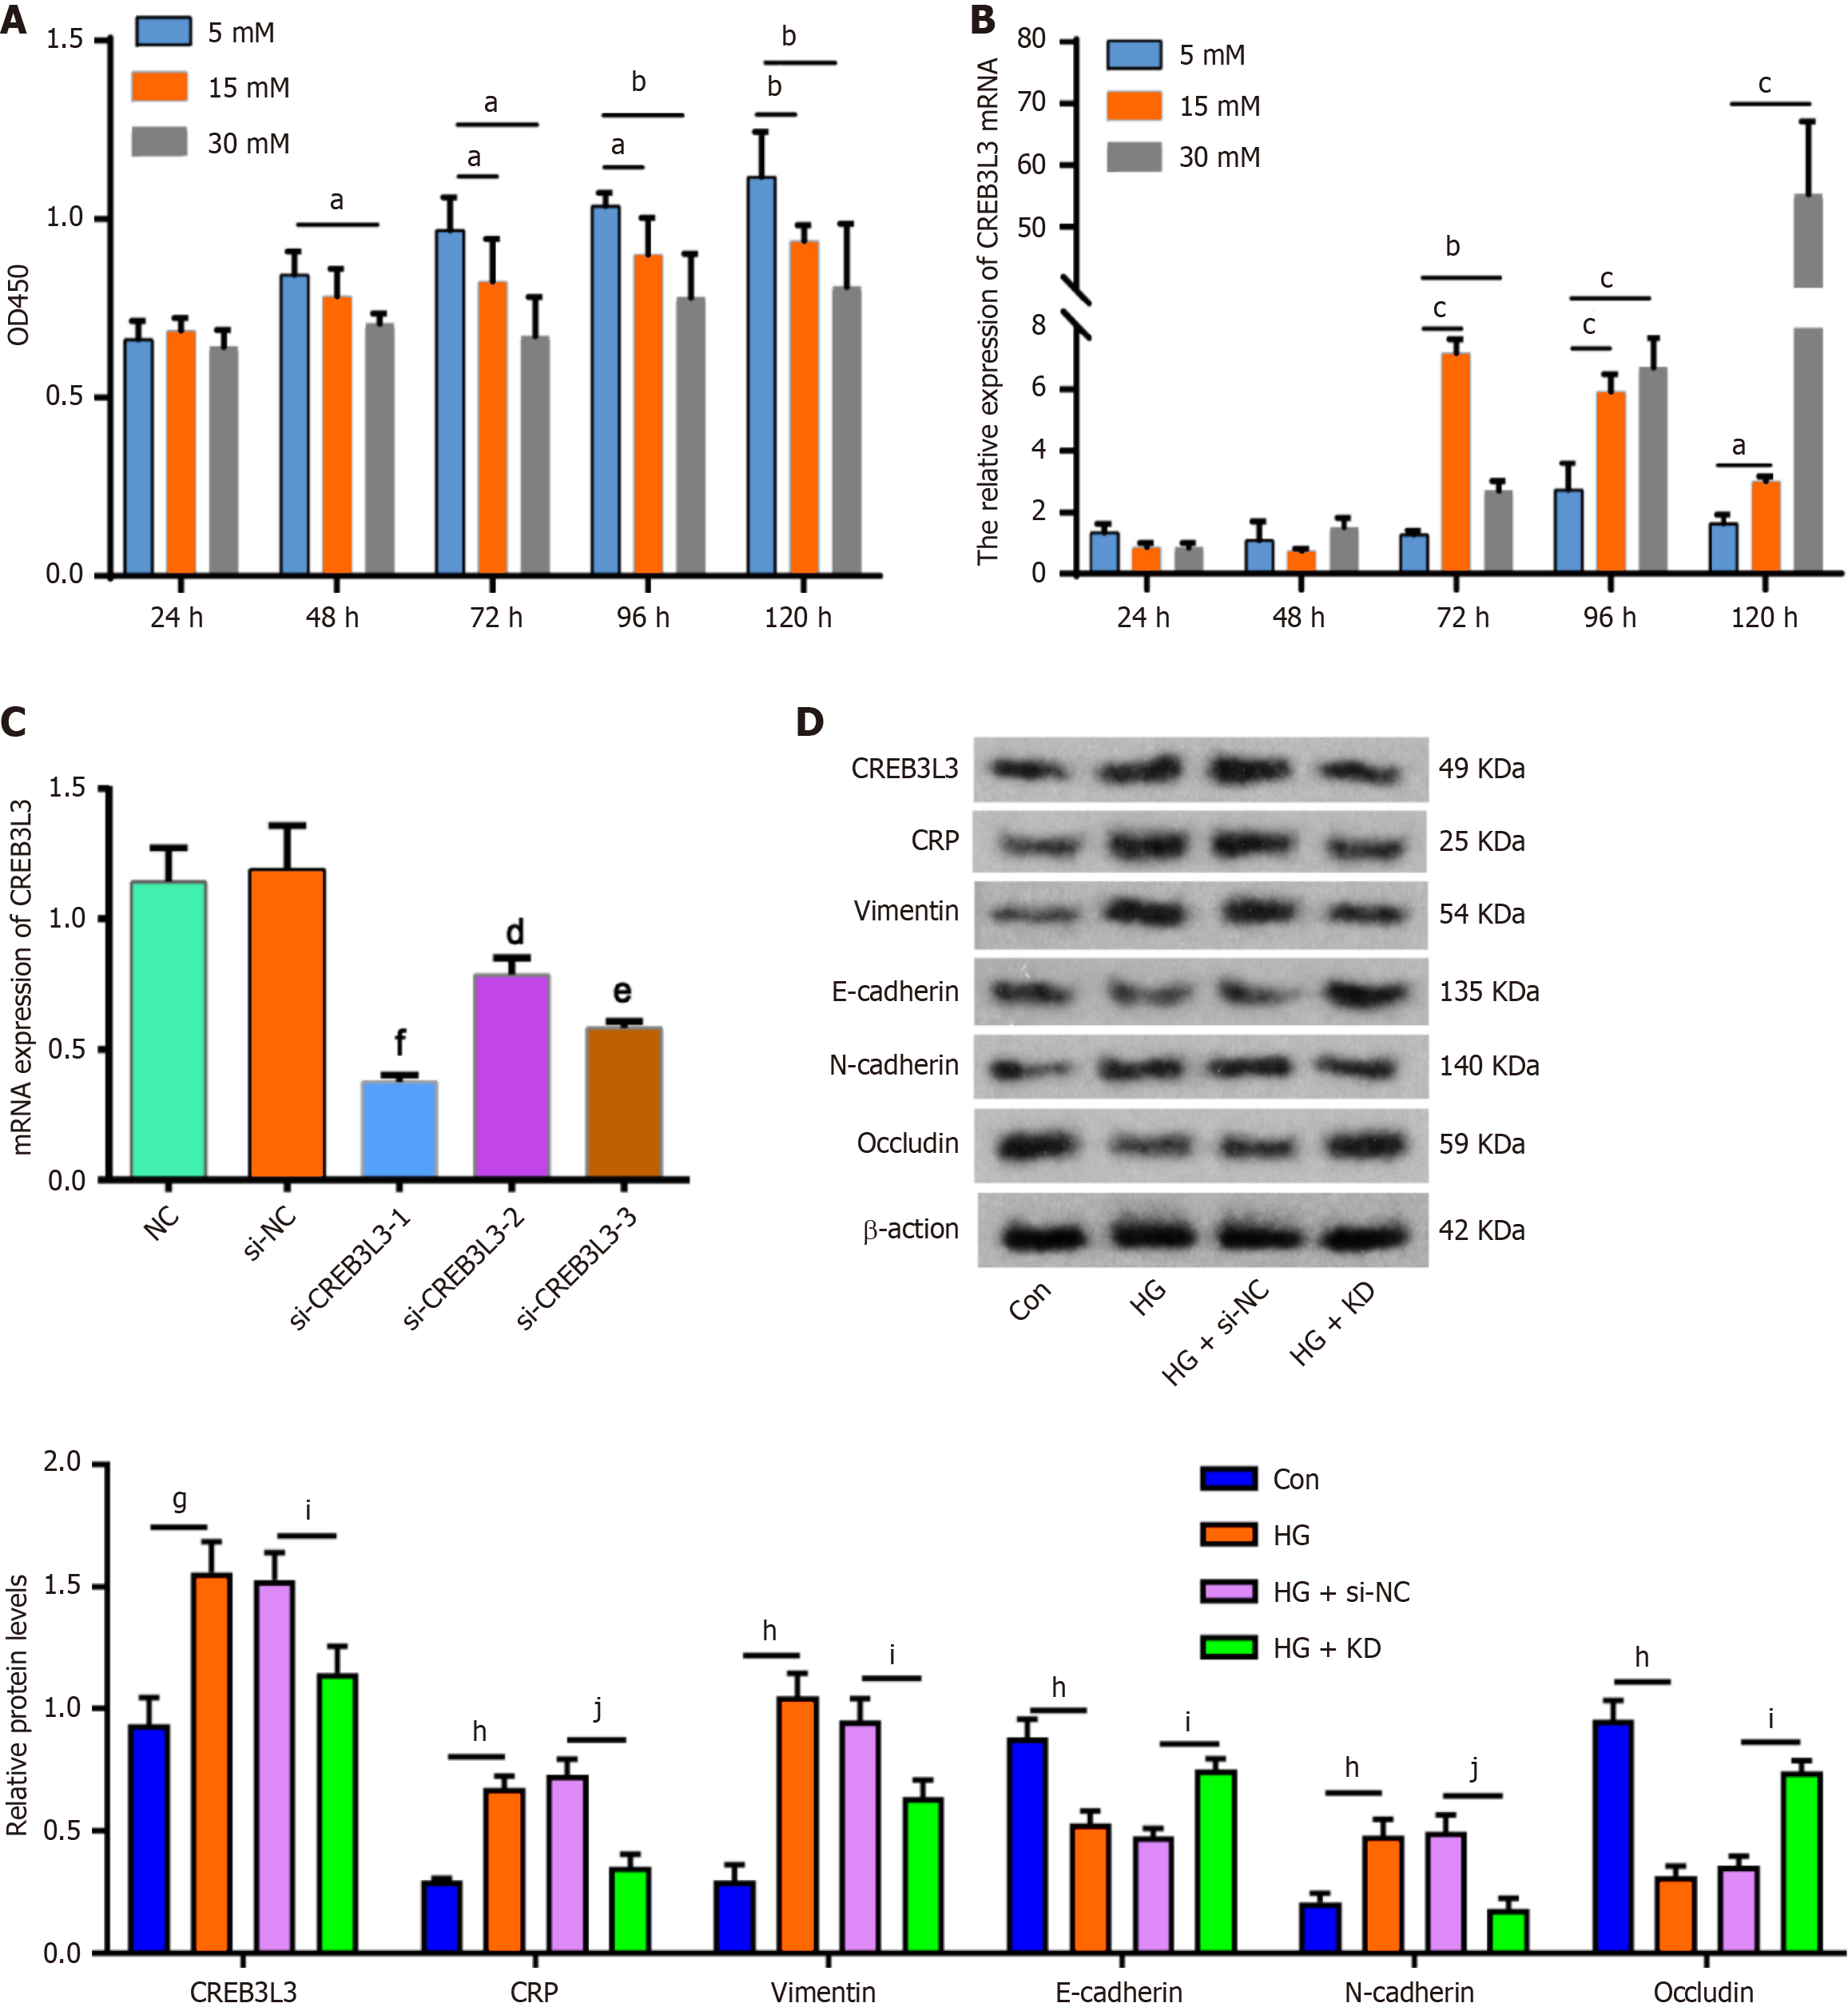
Figure 2 High glucose induces cAMP-responsive element-binding protein 3 Like 3 expression and the epithelial-mesenchymal transition in SV-HUC-1 cells.
A: Cell Counting Kit-8 assay was employed to assess the viability of SV-HUC-1 cells following treatment with varying concentrations of glucose; B: Relative mRNA expression of cAMP-responsive element-binding protein 3 Like 3 (CREB3 L3) in SV-HUC-1 cells after treating with different levels of glucose, as detected by quantitative PCR; C: Relative mRNA expression of CREB3 L3 in SV-HUC-1 cells with or without silencing of CREB3 L; D: SV-HUC-1 cells were treated with 5 mmol/L and 15 mmol/L glucose for 72 hours with and without CREB3 L3 knockdown (KD). Protein expression of CREB3 L3, C-reactive protein (CRP), vimentin, N-cadherin, E-cadherin, and occludin in SV-HUC-1 cells in the control (Con), high glucose (HG), HG + small interfering RNA negative control (si-NC), and HG + KD group. Each group contained three biological replicates. aP < 0.05 vs 5 mmol/L group, bP < 0.01 vs 5 mmol/L group; cP < 0.001 vs 5 mmol/L group, dP < 0.05 vs si-NC group, eP < 0.01 vs si-NC group, fP < 0.001 vs si-NC group, gP < 0.01 vs Con group, hP < 0.001 vs Con group, iP < 0.01 vs HG + si-NC group, jP < 0.001 vs HG + si-NC group.
- Citation: Wu QG, Zhang MJ, Lan YB, Ma CL, Fu WJ. Hyperglycemia-induced overexpression of CREB3 L3 promotes the epithelial-to-mesenchymal transition in bladder urothelial cells in diabetes mellitus. World J Diabetes 2025; 16(8): 108101
- URL: https://www.wjgnet.com/1948-9358/full/v16/i8/108101.htm
- DOI: https://dx.doi.org/10.4239/wjd.v16.i8.108101


