
















©The Author(s) 2025.
World J Diabetes. Dec 15, 2025; 16(12): 110494
Published online Dec 15, 2025. doi: 10.4239/wjd.v16.i12.110494
Published online Dec 15, 2025. doi: 10.4239/wjd.v16.i12.110494
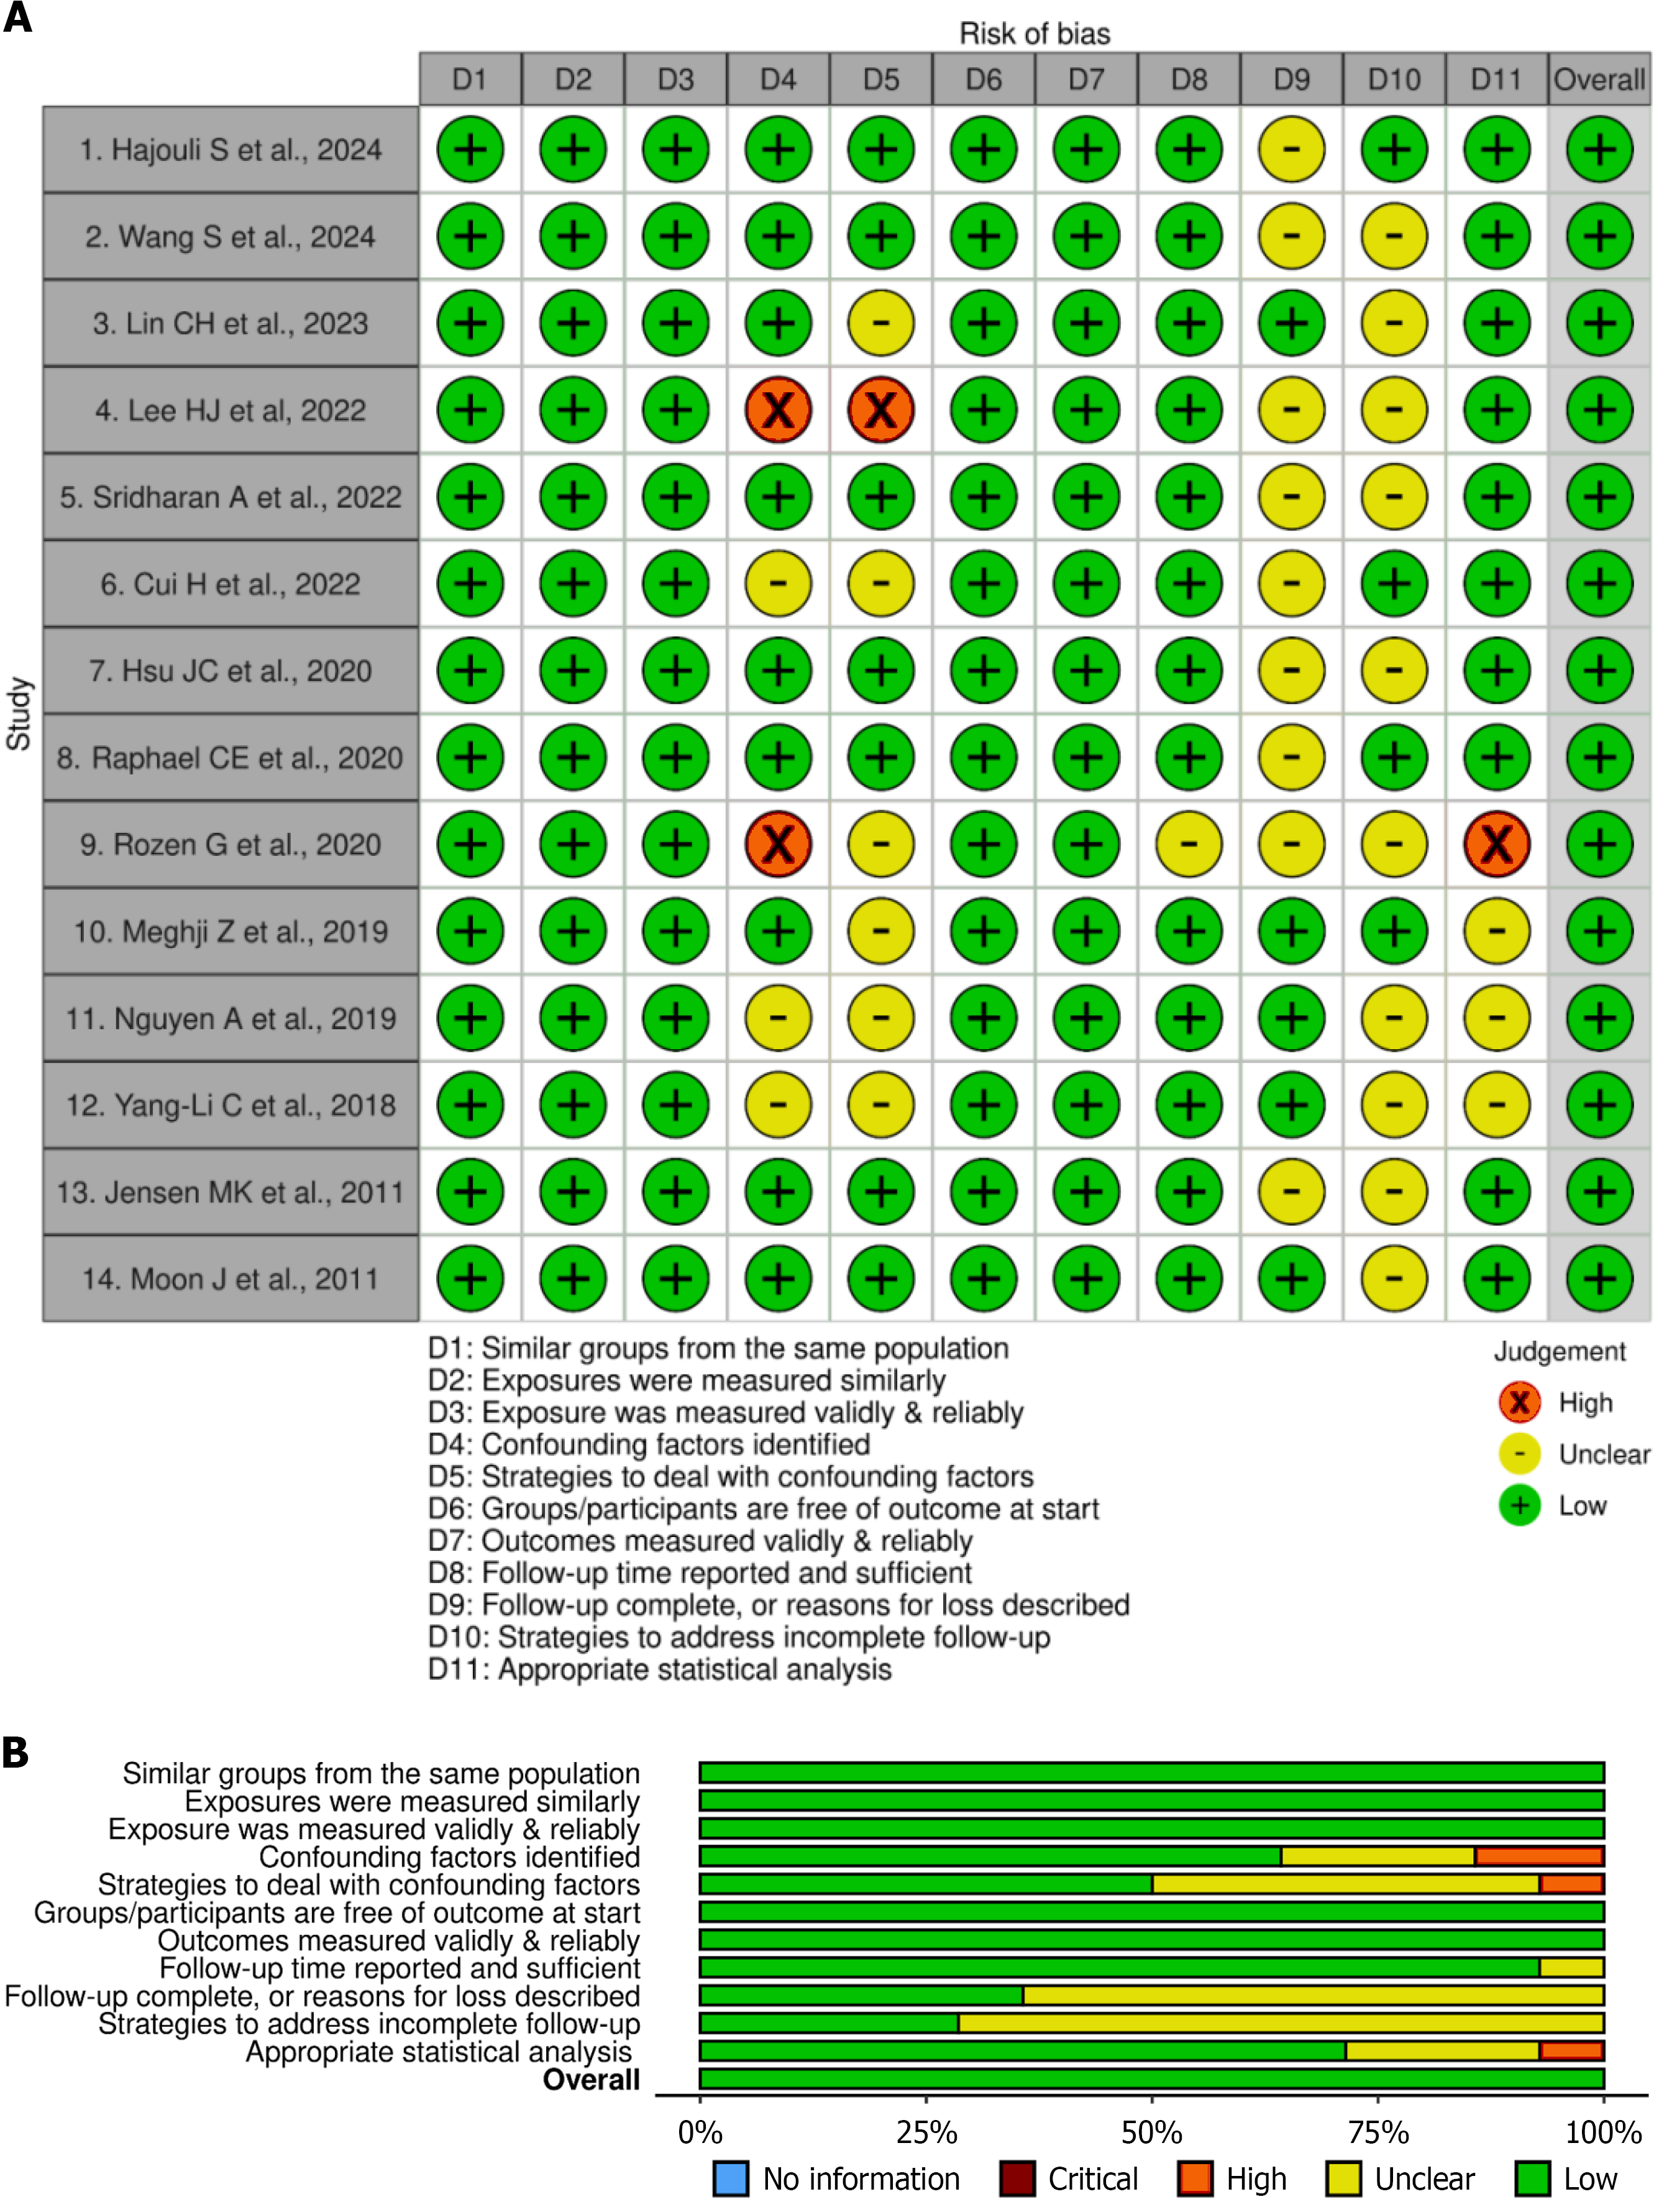
Figure 3 Traffic light and summary plot based on the Joanna Briggs Institute quality appraisal tool.
A: The traffic light plot displays the risk of bias assessment across the 14 included cohort studies using the Joanna Briggs Institute tool. Most studies demonstrated low risk across key domains, particularly in population selection, exposure measurement, and outcome assessment. However, moderate concerns were noted in domains related to confounding factors (D4, D5) and follow-up completeness (D9, D10), where several studies received “unclear” judgments. Notably, two studies (Lee et al[16] and Rozen et al[21]) showed high risk in confounding factor identification. Despite these limitations, 12 studies were rated overall as high quality (green), while two were moderate quality (yellow), supporting the robustness of the review; B: The summary plot of the risk of bias assessment across all included studies, based on the Joanna Briggs Institute tool. Each horizontal bar represents the proportion of studies judged as low (green), unclear (yellow), or high (red) risk of bias for each of the 11 quality domains. Most domains, including population similarity, exposure measurement, and statistical analysis, were consistently rated as low risk. However, domains related to confounding factors (D4-D5) and follow-up reporting (D9-D10) showed notable proportions of unclear and high-risk ratings. Overall, the majority of studies demonstrated sound methodological quality.
- Citation: Damarlapally N, Vempati R, Doshi KM, Singh M, Prajapati K, Modi D, Singh P, Desai R. Impact of diabetes mellitus on mortality and atrial fibrillation in hypertrophic cardiomyopathy: A systematic review and meta-analysis. World J Diabetes 2025; 16(12): 110494
- URL: https://www.wjgnet.com/1948-9358/full/v16/i12/110494.htm
- DOI: https://dx.doi.org/10.4239/wjd.v16.i12.110494